* Crude's strongest daily gain since OPEC deal announced in 2016
* Investors still worried about global economic growth
* Russia's Sechin sees oil at $50-$53/bbl in 2019
* OPEC+ plan to cut oil output in 2019 lends support
By David Gaffen
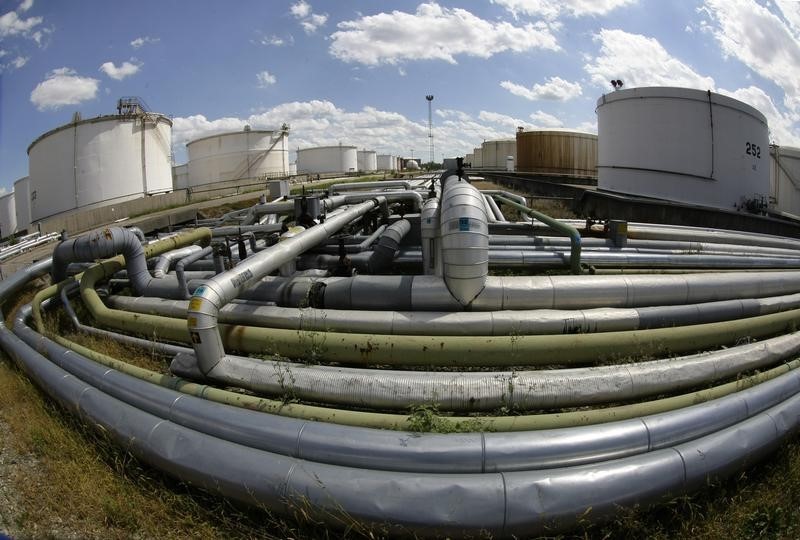
NEW YORK, Dec 26 (Reuters) - Oil surged on Wednesday, posting its strongest daily gain in more than two years in a partial rebound from steep losses that pushed crude benchmarks to lows not seen since 2017.
Both U.S. and Brent crude rose about 8 percent, their largest one-day increase since Nov. 30, 2016, when OPEC signed a landmark agreement to cut production. It was unclear whether follow-through buying would push prices higher again once trading desks are more fully staffed after the new year begins.
Crude has been caught up in wider market weakness as the U.S. government shutdown, higher U.S. interest rates and the U.S.-China trade dispute unnerved investors and exacerbated worries over global growth. MKTS/GLOB
"The market is still really concerned about demand," said Bernadette Johnson, vice president in market intelligence at DrillingInfo in Denver. The sell-off "doesn't signal strength of confidence in demand, but we still went too far too quick. We still believe $45 is too low."
U.S. crude CLc1 settled at $46.22 a barrel, up $3.69, or 8.7 percent. Even with the day's gains, U.S. crude has still lost nearly 40 percent from its October closing high at more than $76 a barrel.
Brent crude LCOc1 , the global benchmark, rose $4, or 8 percent, to settle at $54.47 a barrel. It earlier fell to $49.93, the lowest since July 2017.
In post-settlement trading, crude benchmarks extended gains. U.S. crude was up 10 percent to $46.80 a barrel, while Brent rose 9.2 percent to $55.11 a barrel. Post-settle trading is marked by thin volumes.
Recent selling "has felt less fundamentally driven and more a function of the overall market meltdown as increased equity volatility and growing macro concerns have weighed on a number of asset classes," wrote analysts at Tudor, Pickering & Holt.
Funds have incurred heavy losses in oil markets this year, with the average commodity trading adviser fund, or CTA, down by 7.1 percent on the year through mid-December, according to Credit Suisse (SIX:CSGN) data.
The head of Russian oil company Rosneft ROSN.MM , Igor Sechin, predicted an oil price of $50 to $53 in 2019, far short of the four-year high of $86 for Brent crude reached earlier this year. oil's outlook is not as weak as in 2016 when a supply glut built up, because the Organization of the Petroleum Exporting Countries this time is trying to prop up the market, Jakob said.
OPEC and its allies, including Russia, decided earlier this month to cut production in 2019, unwinding a June decision to pump more oil. The combined group plans to lower output by 1.2 million bpd next year.