Get 40% Off
👀 👁 🧿 All eyes on Biogen, up +4,56% after posting earnings. Our AI picked it in March 2024.
Which stocks will surge next?
Unlock AI-picked Stocks

Whether It Breaks Or Reverts To This Year’s Trend, 0.8500 Is Key For NZD/CAD

Published 2019-11-14, 09:10 a/m
Updated 2023-07-09, 06:31 a/m

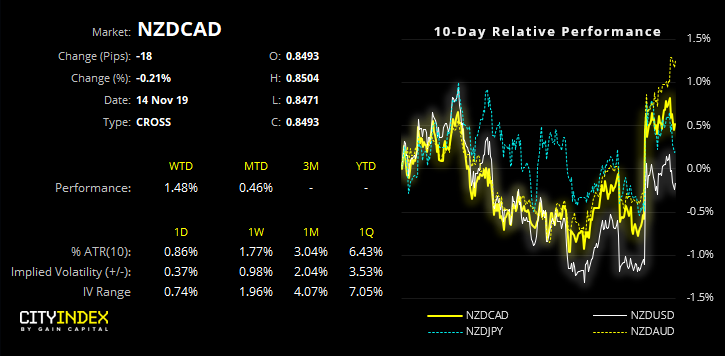
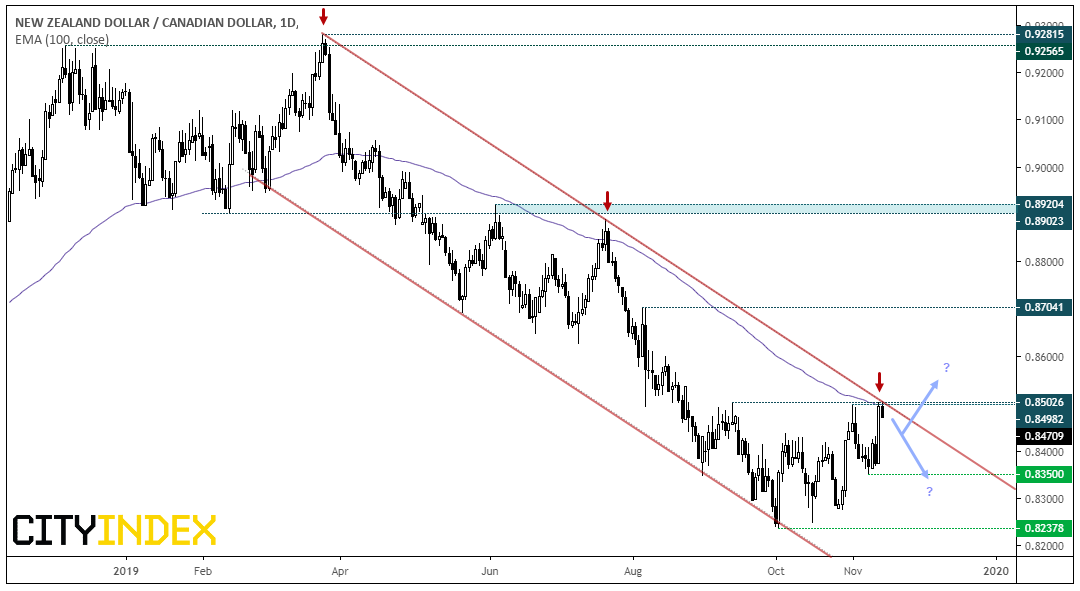
Just as NZD/CAD tests a key level of resistance, it’s worth considering its potential for a change of trend. Personally, I think the bearish trend on NZD/CAD has been one of the better ones for FX traders this year. Since failing to break a key resistance level in March, the commodity FX cross tumbled over 11% (or over 1,000 pips) within a relatively clean downtrend.

Yet having tested the upper bounds of it bearish channel on the daily chart, NZD/CAD has approached an inflection point and there are compelling arguments for both bulls and bears to consider.

Bearish swing traders could take comfort in the following:

  • Price action remains within the bearish channel projected from the March peak, and the 100-day eMA is also capping as resistance.
  • Timing wise, yesterday’s high is eerily similar distance from its prior leak; the first spanned 85 days and yesterday’s spanned 82 days.
    • While prices have recovered nearly 3% from this year’s low, the overlapping nature if price swings suggest the rebound is corrective, so poised to turn lower once more.

    • Bank of Canada has rates at a ‘whopping’ 1.75% compared with RBNZ’s 1.0%, which provides Canada a positive yield differential with New Zealand.

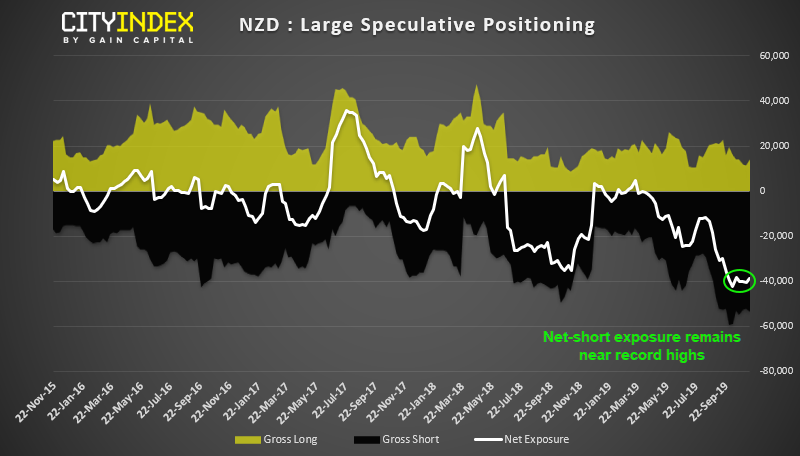
    Contrarians (bulls in this instance) could take note of the following:

    • Net-short exposure on NZD futures remains near a historical extreme. The 3-year Z-score is around -3.5 standard deviations and the 1-year was recently below -2 SD level which have been associated with a short squeeze historically. Ultimately, NZD could be vulnerable to short covering (as seen yesterday) if data improves and / or RBNZ are less dovish.

    • While differentials currently favour CAD, markets will respond if they suspect this differential will narrow, which would be positive for NZD/CAD. And as it’s possible RBNZ will hold at 1% so, if CAD data weakens, then it could well send NZD/CAD higher.

  • The CA2-NZ2 year differential is on the cusp of braking its bearish trendline.
    • Yes, prices have stalled near a cluster of resistance. Yet, if these levels are to be broken, it could trigger stops and exacerbate a bullish follow through.

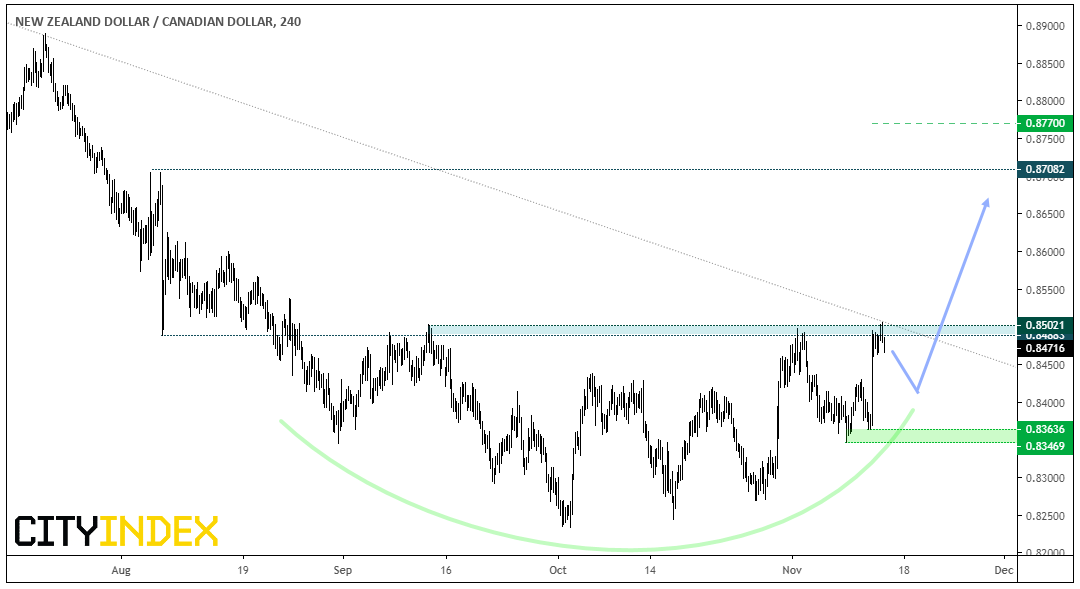
    Given the importance of 0.8500 resistance, NZD/CAD could well turn lower over the near-term. Yet, due to the strength of momentum leading into resistance, an eventual upside break is the bias whilst prices hold above the 0.8347/63 lows. Also take note of the rounding bottom forming which, if successful, projects an approximate target around 0.8770.

    • Bears could look to fade into moves below the trendline and/or 0.8500 resistance

  • Bulls could wait for a break above 0.8500 to confirm the rounding bottom and target the 0.8700 highs (although target projects 0.8770)
  • Alternatively, for those who like to scale in, bulls could look for dips above the 0.83470/36 lows in anticipation of a breakout
  • 3rd party Ad. Not an offer or recommendation by Investing.com. See disclosure here or remove ads .

    Latest comments

    Risk Disclosure: Trading in financial instruments and/or cryptocurrencies involves high risks including the risk of losing some, or all, of your investment amount, and may not be suitable for all investors. Prices of cryptocurrencies are extremely volatile and may be affected by external factors such as financial, regulatory or political events. Trading on margin increases the financial risks.
    Before deciding to trade in financial instrument or cryptocurrencies you should be fully informed of the risks and costs associated with trading the financial markets, carefully consider your investment objectives, level of experience, and risk appetite, and seek professional advice where needed.
    Fusion Media would like to remind you that the data contained in this website is not necessarily real-time nor accurate. The data and prices on the website are not necessarily provided by any market or exchange, but may be provided by market makers, and so prices may not be accurate and may differ from the actual price at any given market, meaning prices are indicative and not appropriate for trading purposes. Fusion Media and any provider of the data contained in this website will not accept liability for any loss or damage as a result of your trading, or your reliance on the information contained within this website.
    It is prohibited to use, store, reproduce, display, modify, transmit or distribute the data contained in this website without the explicit prior written permission of Fusion Media and/or the data provider. All intellectual property rights are reserved by the providers and/or the exchange providing the data contained in this website.
    Fusion Media may be compensated by the advertisers that appear on the website, based on your interaction with the advertisements or advertisers.
    © 2007-2024 - Fusion Media Limited. All Rights Reserved.