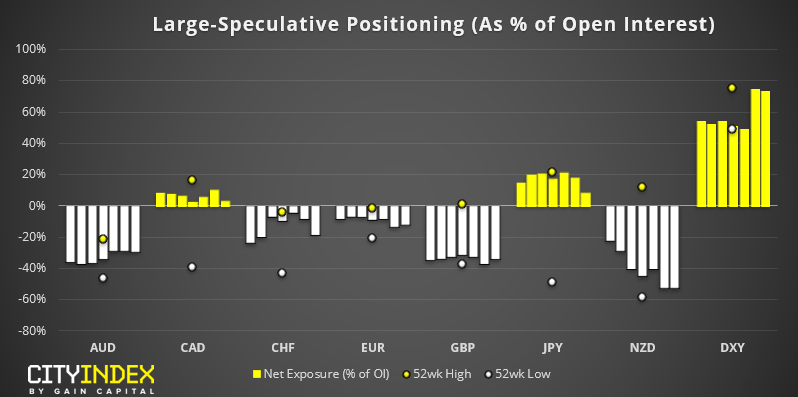
As of Tuesday, Sept. 24:
- Bullish exposure to the USD is at $17.4 billion, its highest level in 3 months.
- CAD traders reduced net-long exposure by -15.2k contracts, their least bullish positioning since June.
- Net-long exposure to JPY was reduced by 11.1k contracts.
- Bearish exposure to NZD hit a fresh record high.
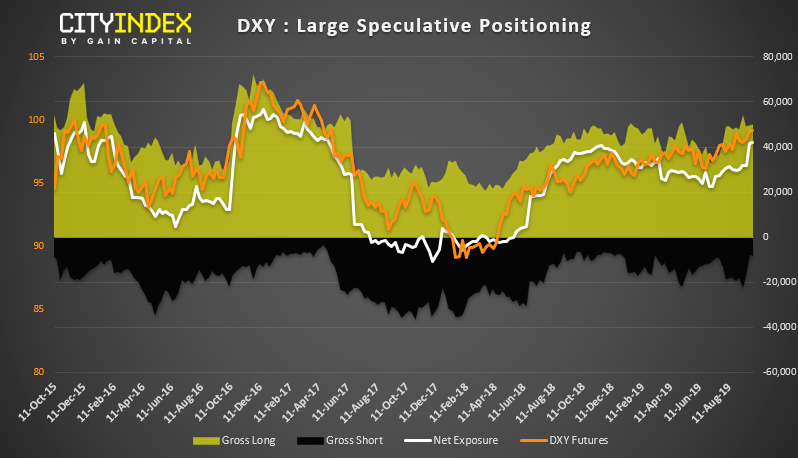
DXY: Bullish exposure to the dollar index is its highest level since April 2017. It saw a sharp spike higher two weeks ago, yet this was mostly fuelled by the closure of gross long positions, as opposed to the initiation of fresh long. Perhaps the explains why the price action on DXY remains choppy and appears reluctantly bullish. But with it just off multi-year highs, a bullish breakout could well trigger short covering and finally see a convincing initiation of long bets. Keep DXY on your watchlist.
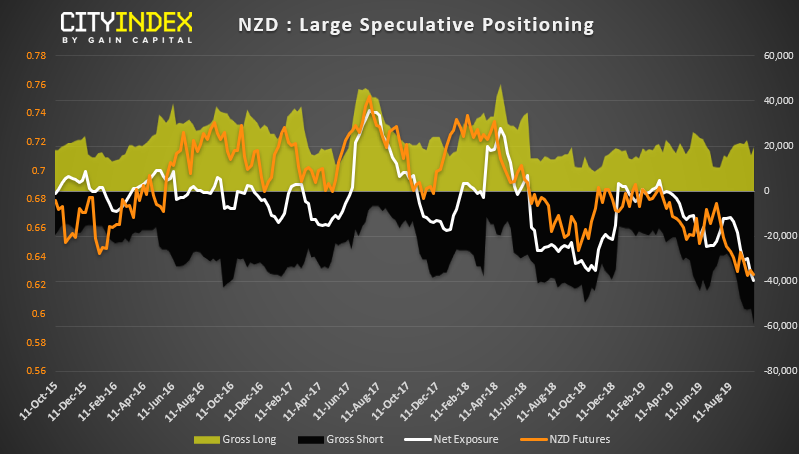
NZD: Bears have not shied away from shorting the Kiwi dollar. In fact, net-short exposure hit a fresh record high, Net-short exposure to NZD futures hit -2 standard deviations, according to the 1-year Z-score to -2 SD and the 3-year to a whopping -3.7 SD. Simply put, NZD is at high risk of a sentiment extreme so could be vulnerable to a bullish rally if economic data allows. With many kiwi crosses looking overstretched to the downside, we’ll be keeping a close eye on the potential for bases to form.
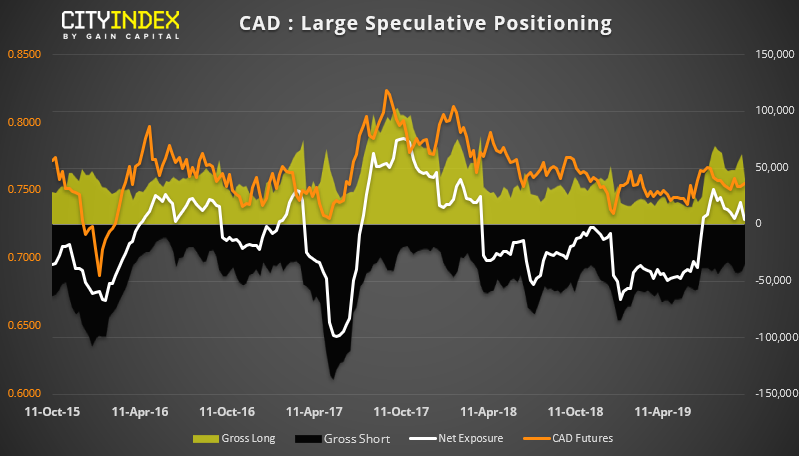
CAD: Canadian dollar bulls appear spooked after culling net-long exposure by -15.2k contracts. It’s their least bullish exposure since flipping to net-long back in June, although it also worth noting that gross short positioning also declined by -6.5k contracts. Weak retail sales data may have been the culprit, although this shift in sentiment wasn’t really reflected in price action. Still, with large speculators now close to flipping to net-short, traders should be closely watching for signs of weak data or dovish commentary from Bank of Canada, given the other major central banks are in a race to the bottom.
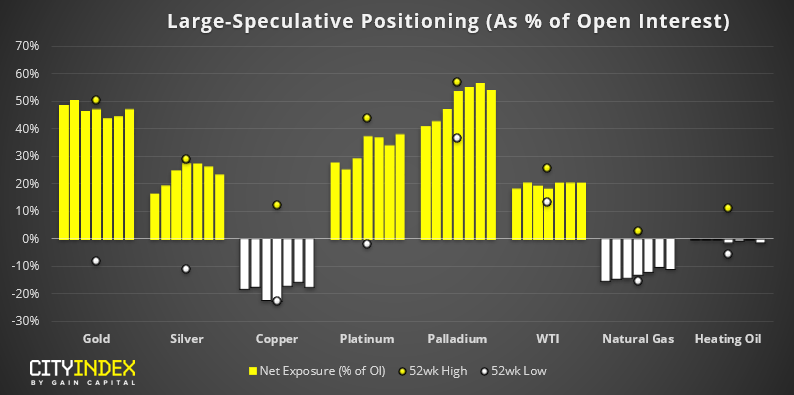
As of Tuesday, Sept. 24:
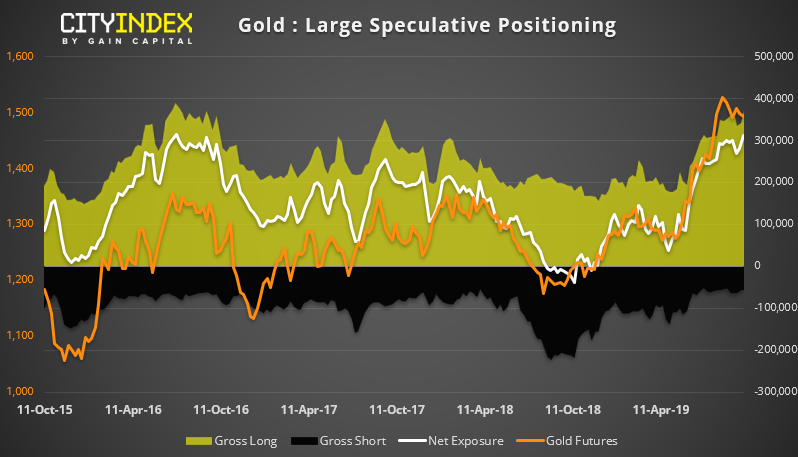
- Gold bugs were their most bullish on the yellow metal in over 3 years.
- Traders were their most bearish on VIX in 4 months.
- Copper remained net-short for a 22nd consecutive week.
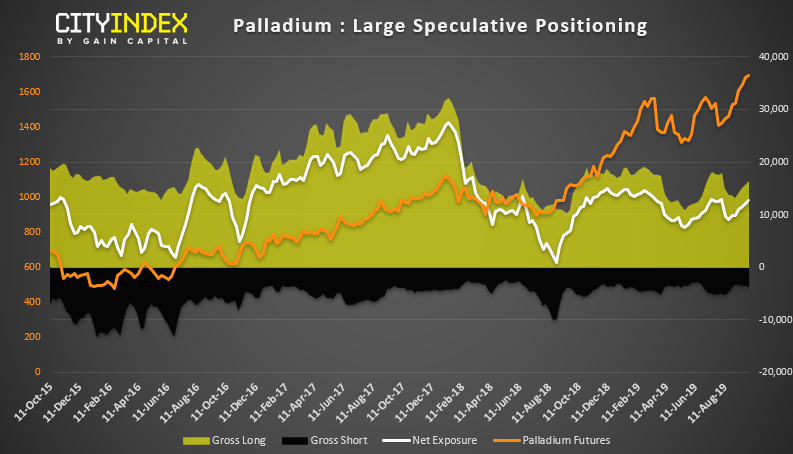
- Net-long exposure to palladium was its most bullish in 8-weeks (with prices now trading at record highs).
Gold: Traders are their most bullish on gold since July 2016. 28.9k long contracts were added and -963 shorts were closed, which now sees 6.4 bullish contracts per bearish contract (one of the highest levels the ratio has been since September 2012). Not surprisingly, the 3-year Z-score also suggests a sentiment extreme with it being +2.6 SD. But, until price action confirms a top with a break of key support around $1480, the trend remains defiantly bullish.
Palladium: The trend on palladium remains firmly bullish with prices testing record highs today in Asia. However, with 1- and 3-year Z-scores remaining low at 0.35 and 0.1, standard deviations respectively, it doesn’t signal a sentiment extreme.