“Gold” is a song by American country music singer Dierks Bentley. It was released on August 8, 2022, as the first single and partial title track to Bentley’s tenth studio album Gravel & Gold.
Tom Roland of Billboard wrote that the song is “a return to an increasingly familiar theme in his work: the importance of living in the moment, rather than worrying about the future or fretting about the past.” (Wikipedia)
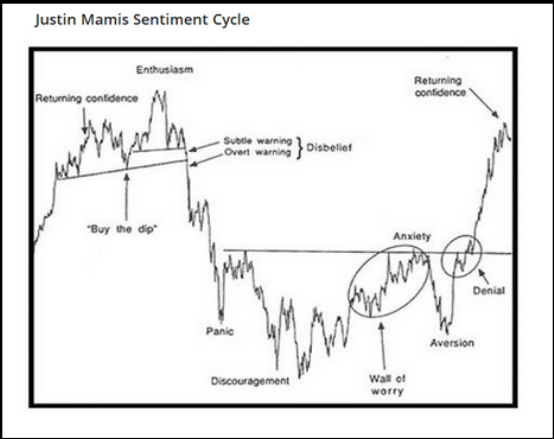
These lyrics are particularly apt as we have discussed in previous weeks’ notes that the markets will continue to “Climb The Wall of Worry” until everyone stops worrying (we are nowhere near that point)! Then they will drop.
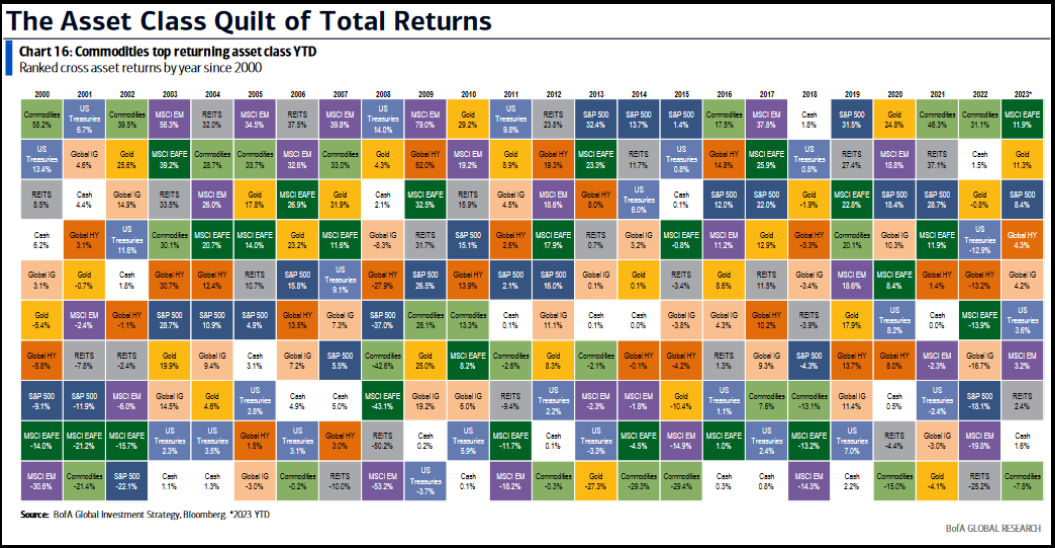
So live in the moment because, “It ain’t a smooth ride, life, it’s a winding road.” But when it comes to equities, gravel or gold, they go UP 70% of the time so you just need to own quality, durable, cash-generative businesses, sit tight and “drive through the rainbow for the pot at the end.”
It ain’t easy, nobody said it would be
You finally find that greener grass, but you’re still in the weeds
Ain’t it crazy, all the time that you spend
Drivin’ through the rainbow for the pot at the end
I got some rust on my Chevy but it’s ready to roll
I got a rhinestone sky and a song in my soul
It ain’t a smooth ride, life, it’s a winding road
Yeah, it might be gravel, but it feels like gold
I’ve been climbin’, tryin’ to get to the view
I’m at the bottom but the sky’s still pretty damn blue
They say heaven is somewhere on the other side
But I ain’t waitin’, hell, I’m thinkin’, it’s a state of mind…
Wall of Worry
On Tuesday I put out a summary of Bank of America’s May Global Fund Manager Survey:
Here were the key points that suggest continued upside for the markets in coming months:
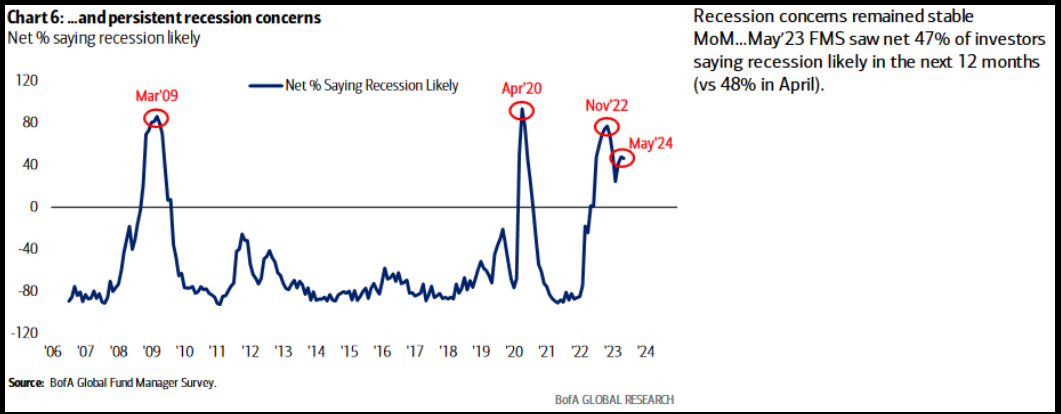
1) By the time “recession concerns” have started rolling over, the bottom in equity markets is well in the rear view mirror:
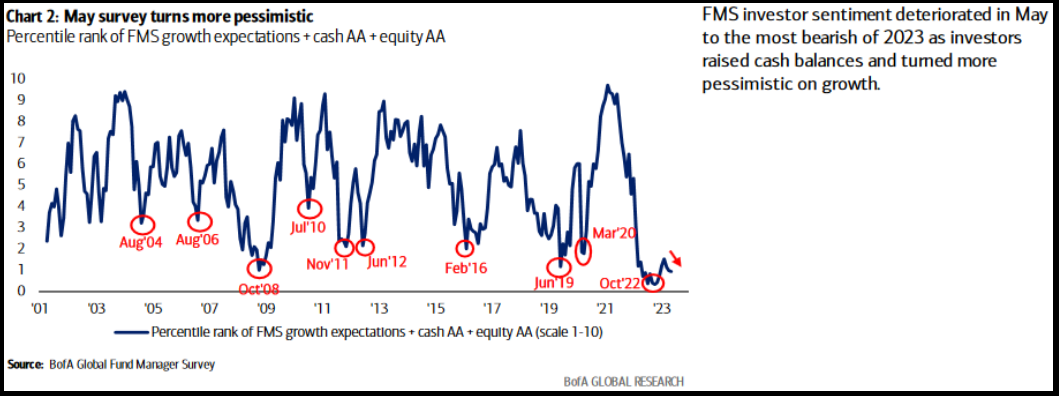
2) The bottom in pessimism is in and resembles the mini “check back” in 1Q 2009 and 2016 when the market had already bottomed:
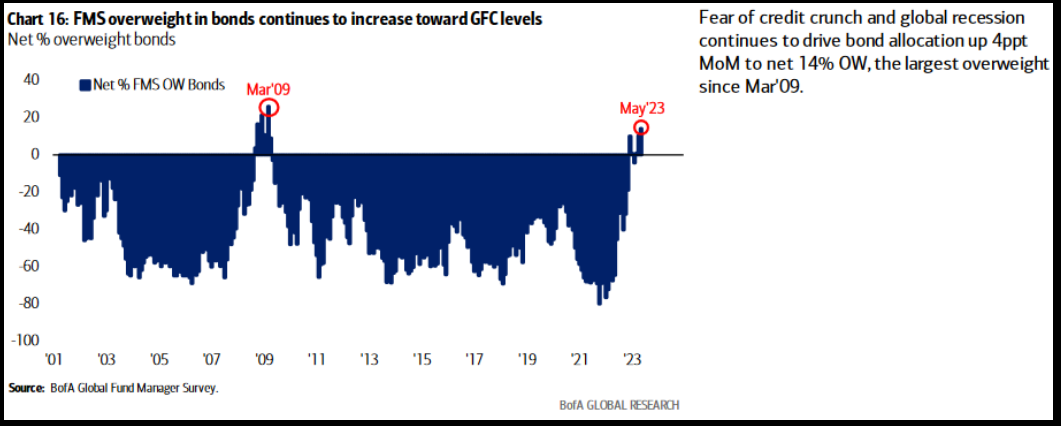
3) Managers are the most overweight bonds relative to stacks since the GFC lows in March 2009. BAD TIME TO BE OUT OF EQUITIES.
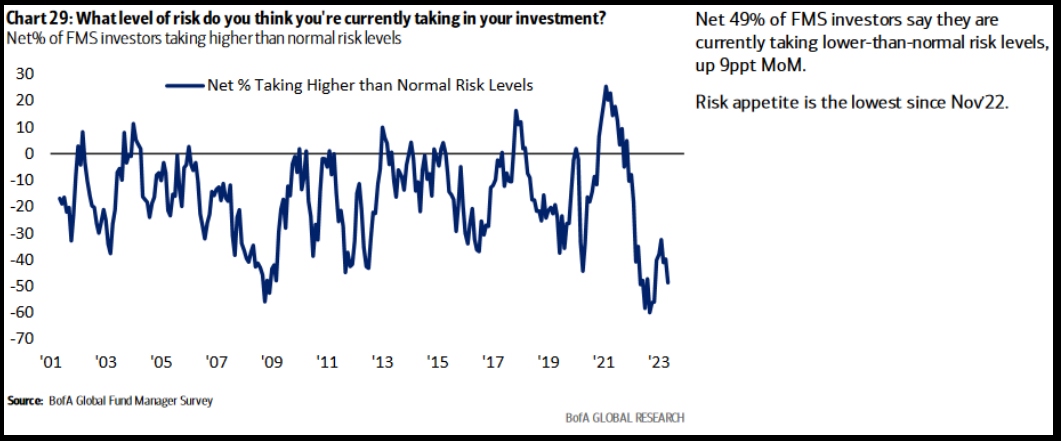
4) Managers are as scared to take risk today as they were at the March 2009 GFC lows:
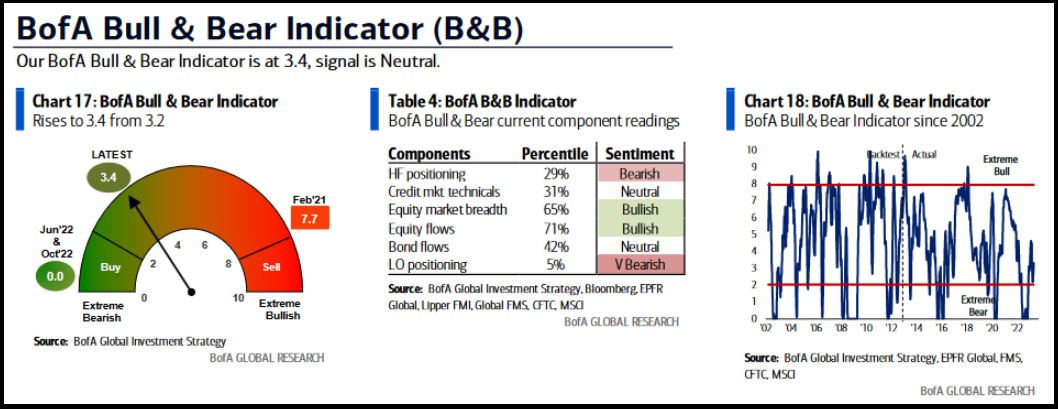
OTHER INDICATIONS:
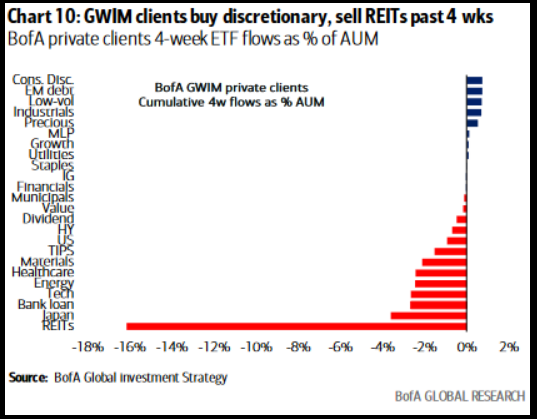
Selling in REITS should be nearing an end:
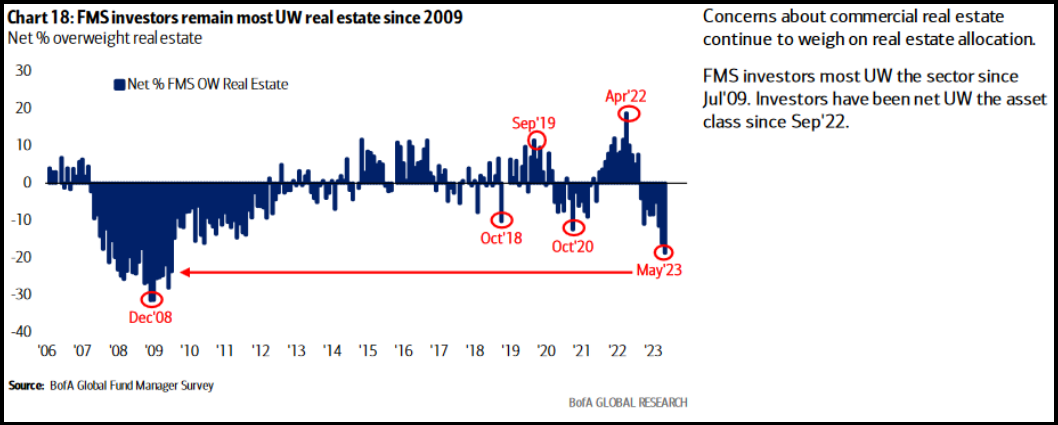
As we’ve repeatedly said, “the last shall be first.” Expect REITS (which was the worst performer last year) to work its way back up to the top in the next 12-24 months as the Fed is finished hiking:
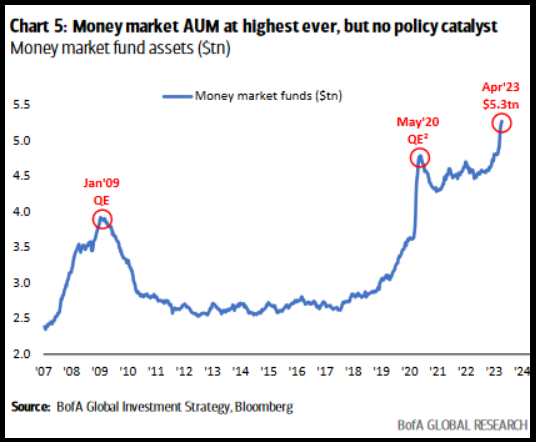
Markets don’t top when everyone is in cash:
Markets top when everyone is overweight stocks on margin. We are nowhere close to that point:
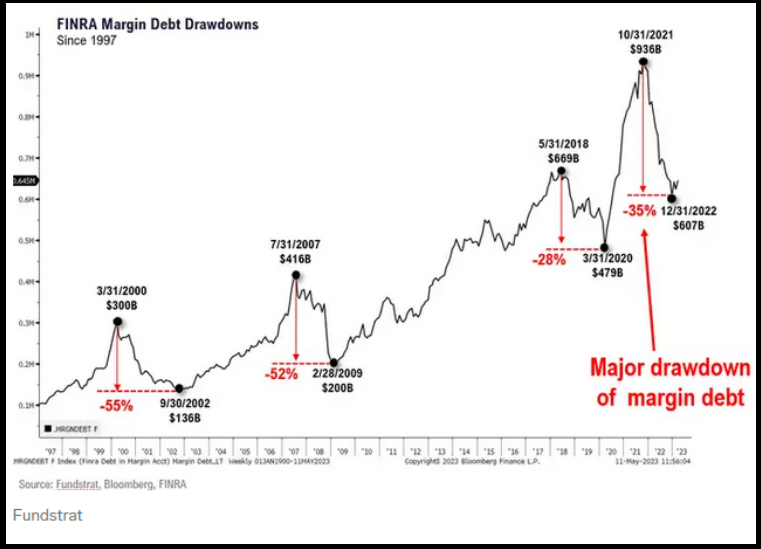
Source: Fundstrat
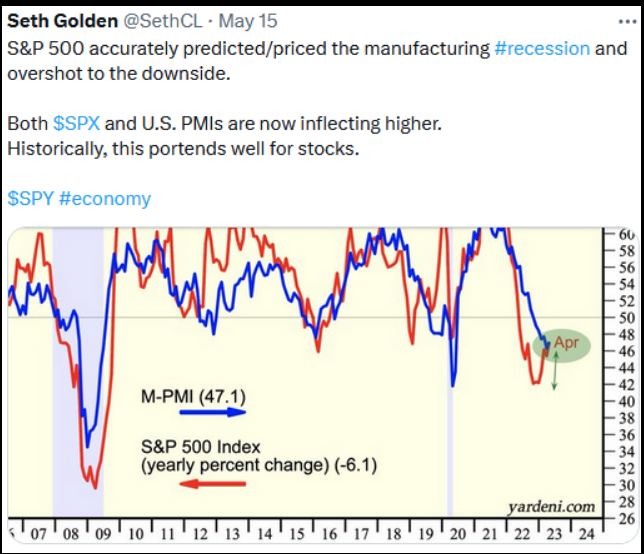
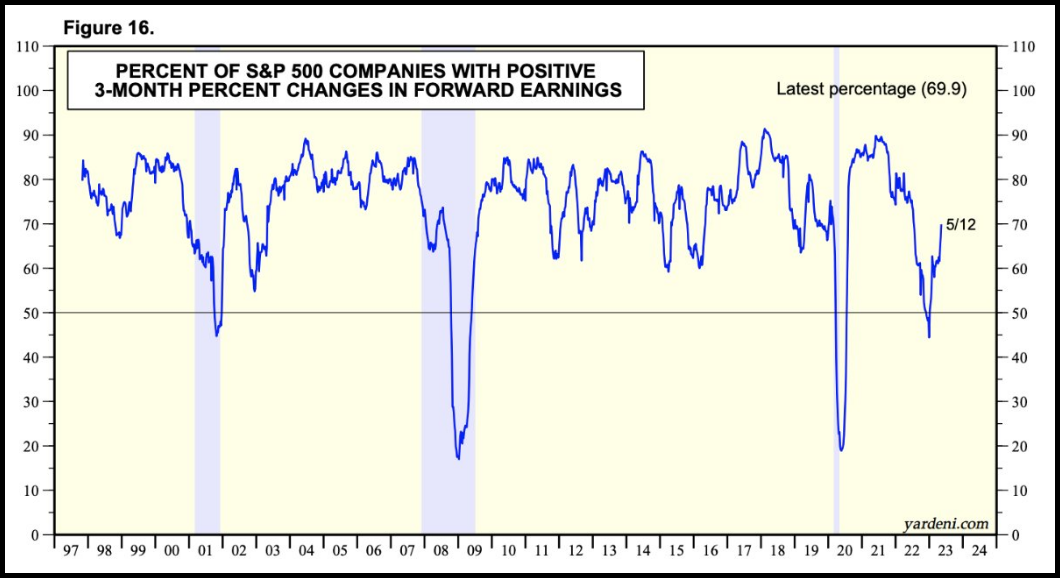
More Positive Earnings Guidance
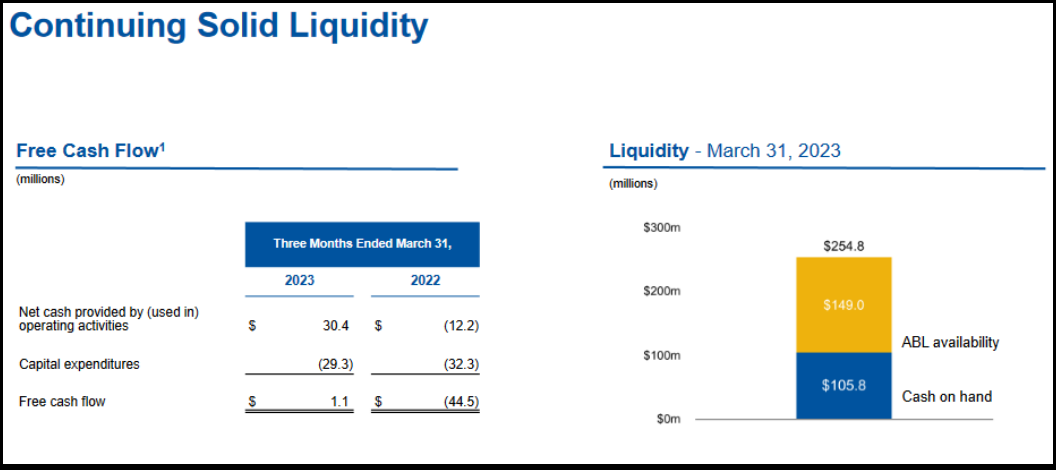
Cooper Standard
While the stock is up almost 100% since our initial purchases last May, there is a lot more room to run.
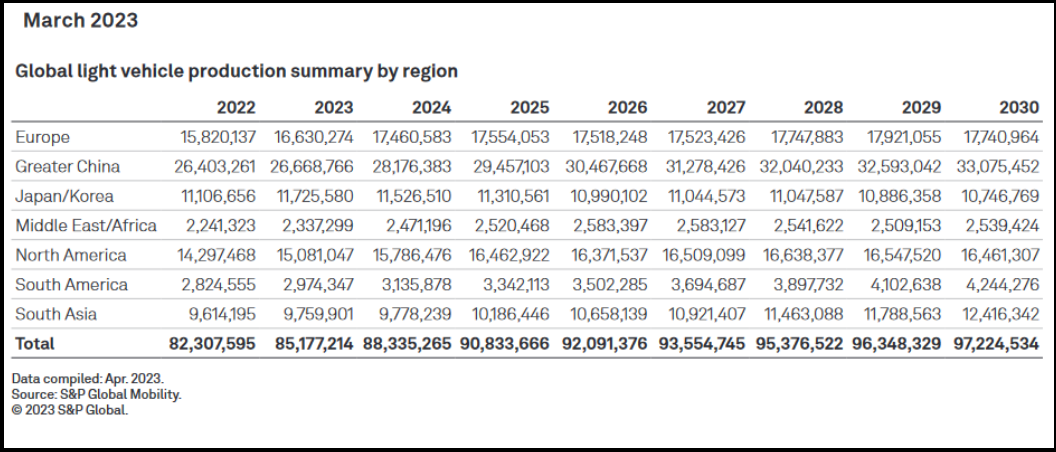
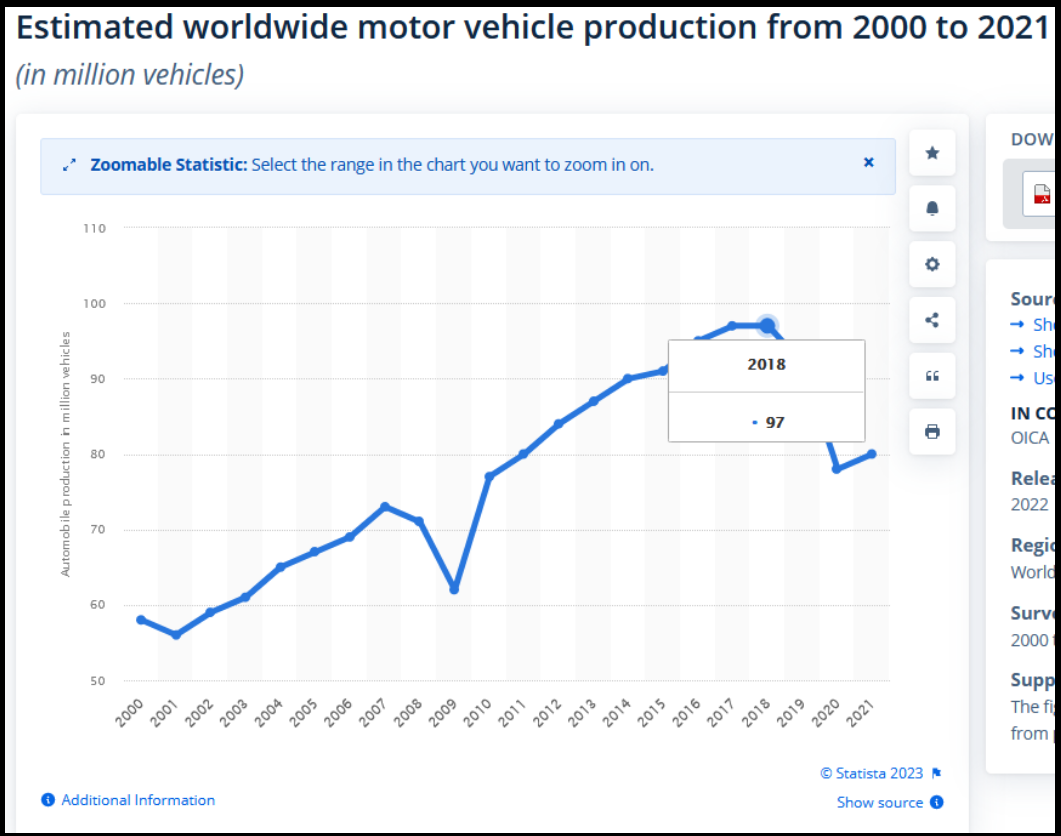
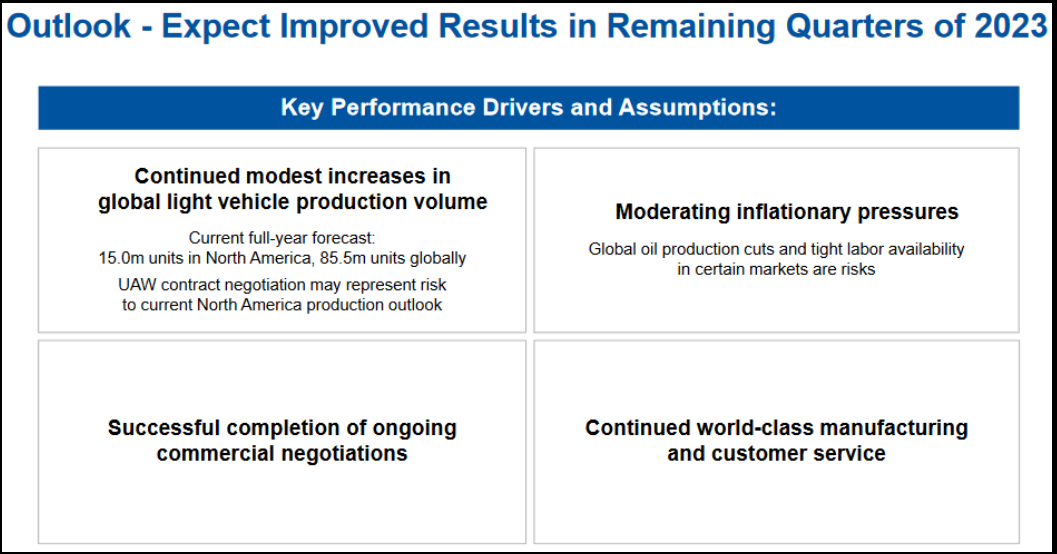
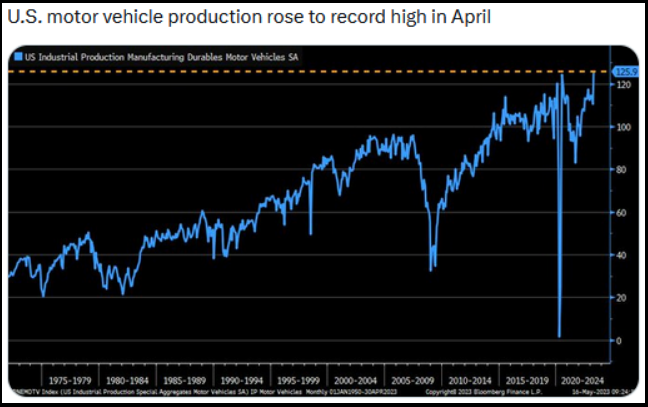
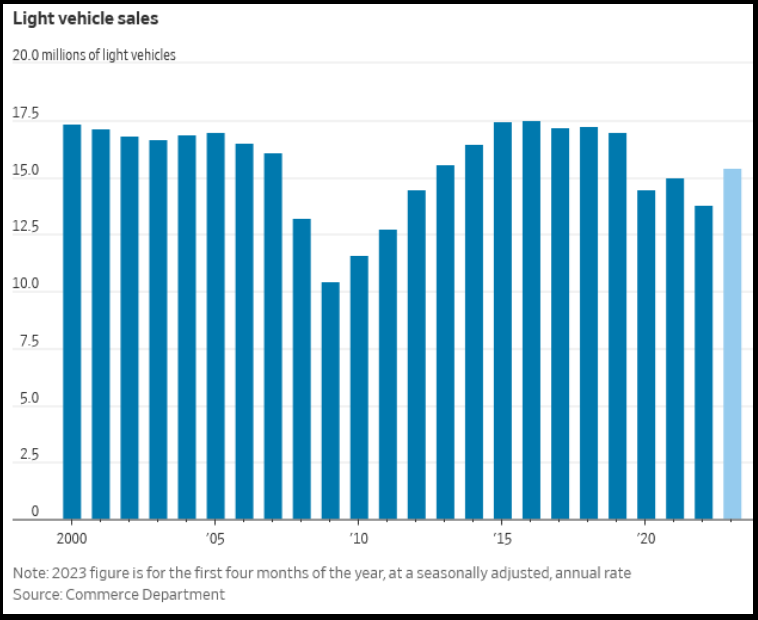
The pandemic aberration is over. In 2017 Global Light Vehicle Production was 97MM. Cooper Standard earned over $7 per share and traded at $140 (~20x). Remember when despondency turns back to euphoria you get multiple expansion. According to S&P (below) we won’t hit 97M, but we don’t have to. North America is already tracking higher than this estimate for 2023. At 90M the company can earn >$7/share again because costs have been gutted and margins are higher on EV which is becoming an increasing share of mix. Haircut it and we’re out around $60-$120/share blended (some lower, some higher). (opinion, not advice – see terms).
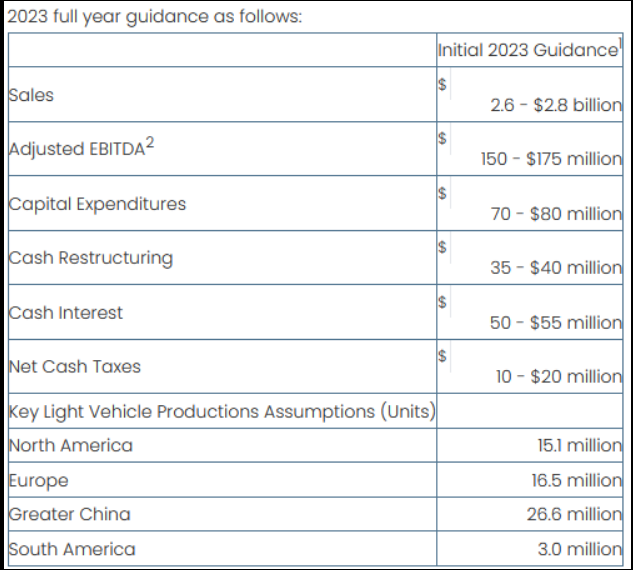
2023 Guidance still tracking:
Updated Data Since earnings:
Alibaba (NYSE:BABA)
We presented our “sum of the parts” analysis in last week’s note. We laid out how the pieces can add up to ~$300/share (and more) over time. Yesterday, Barbara Kollmeyer interviewed me for her MarketWatch article.
The article above may prove to be as important as the last major feature I had on MarketWatch on March 19, 2020 when we called the pandemic stock market bottom (to the day):
https://www.marketwatch.com/
It seems Morgan Stanley (NYSE:MS) agrees as the cash BABA has on hand, plus the free cashflow they can generate over the next 3-4 years is sufficient to buy back 100% of the shares over that period!
We may be the last shareholder standing with a business generating >$30B/year in free cash-flow after all of the float is bought in!!!
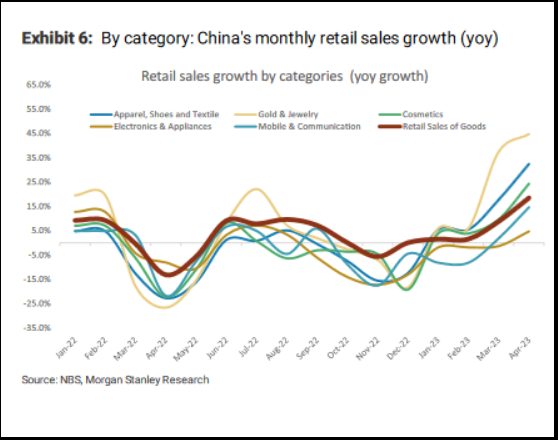
Remember this from our article 2 weeks ago:
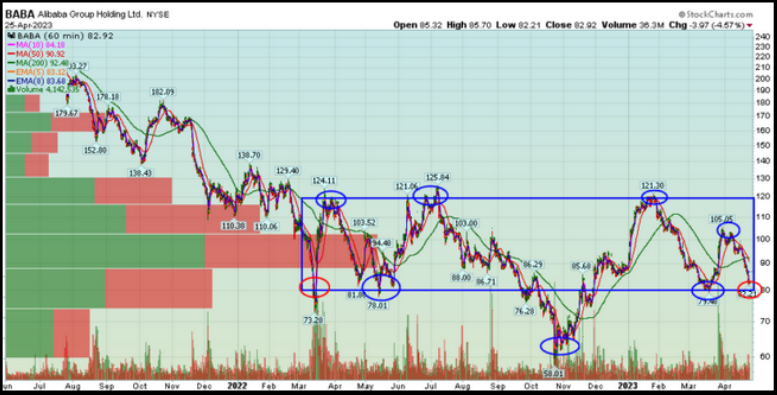
Biotech
We’ve covered all of the valuation catalysts and fundamental catalysts for the biotech sector in previous articles and podcast|videocasts.
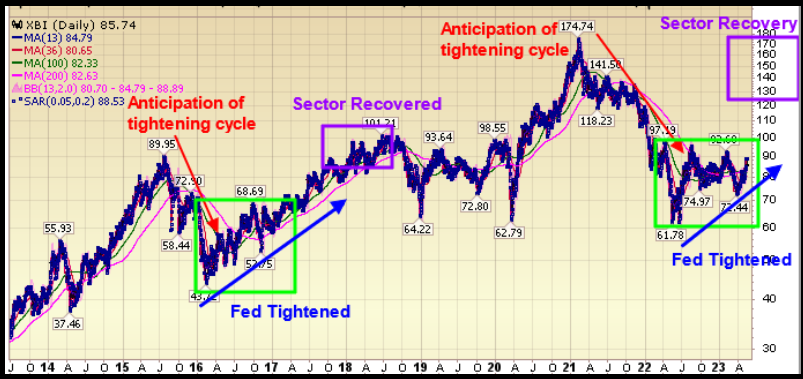
Ultimately, Biotech is just a Fed trade like 2016 – 2018. Sector crashed anticipating tightening cycle; Fed tightened; basket went up; End of story. Same will happen (is happening) this time:
Now onto the shorter term view for the General Market:
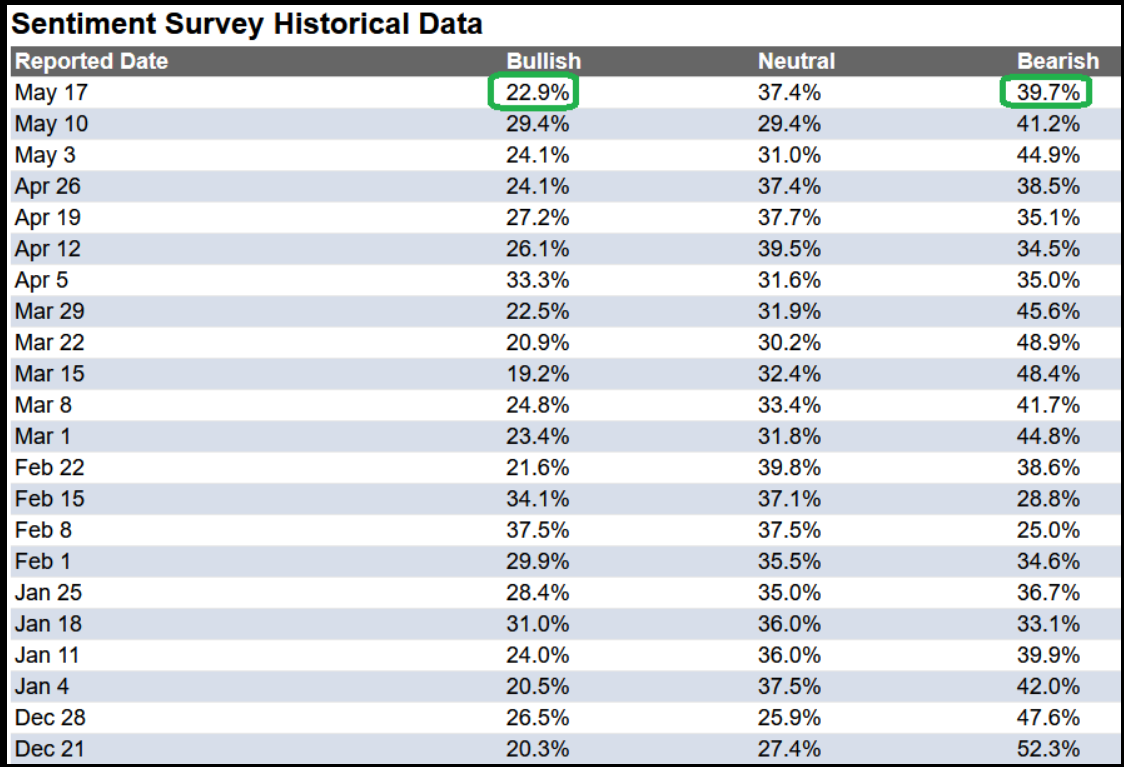
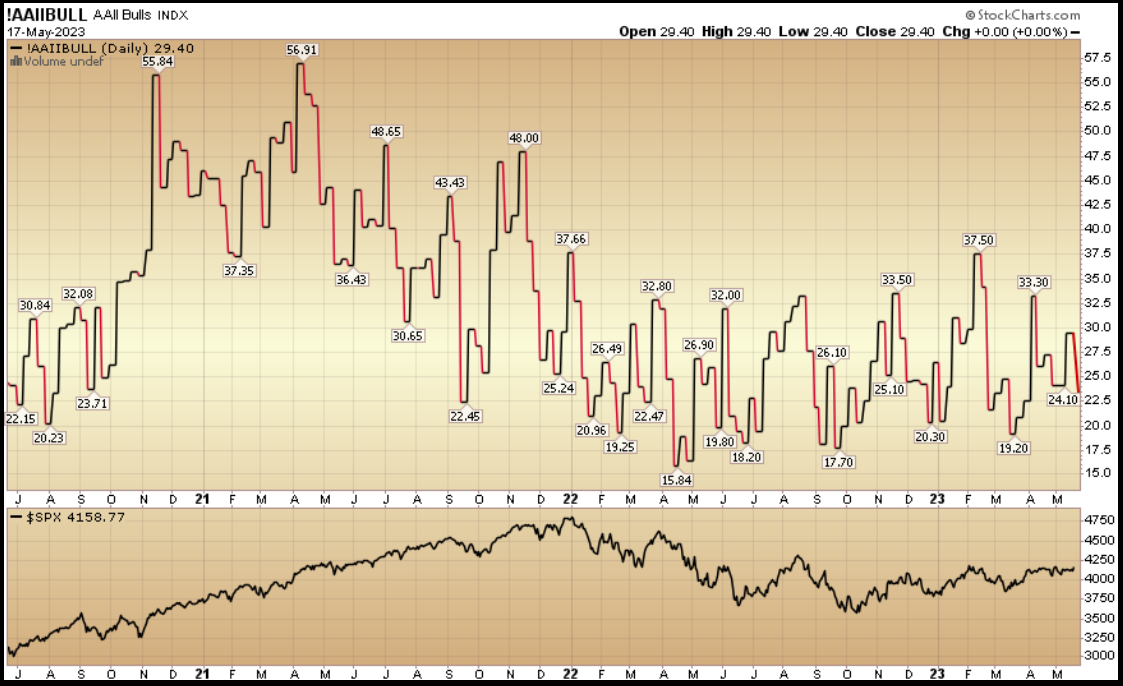
In this week’s AAII Sentiment Survey result, Bullish Percent (Video Explanation) dropped to 22.9% from 29.4% the previous week. Bearish Percent moderated to 39.7% from 41.2%. The retail investor is extremely fearful.
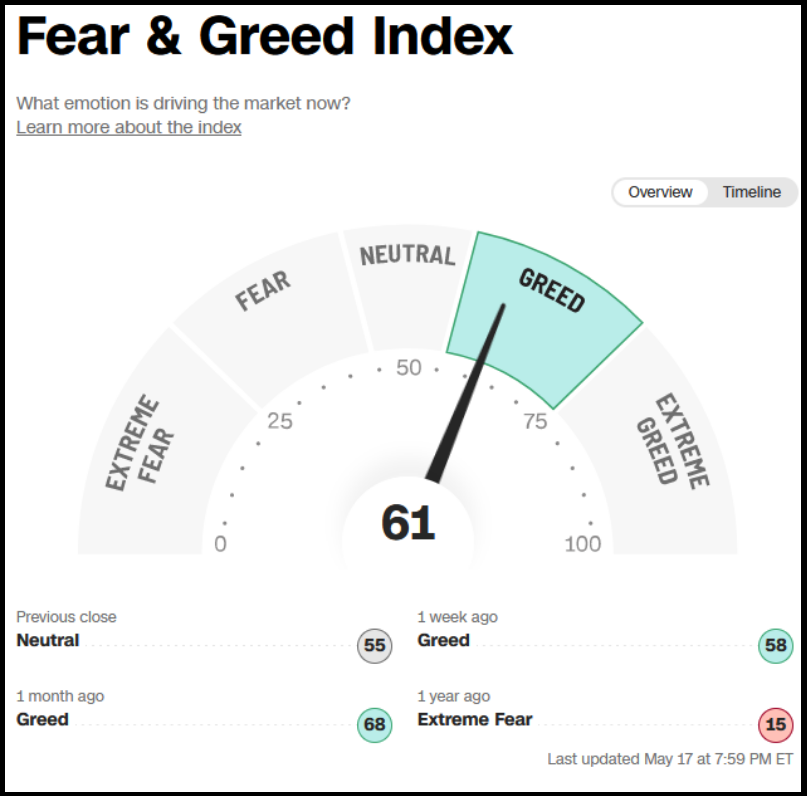
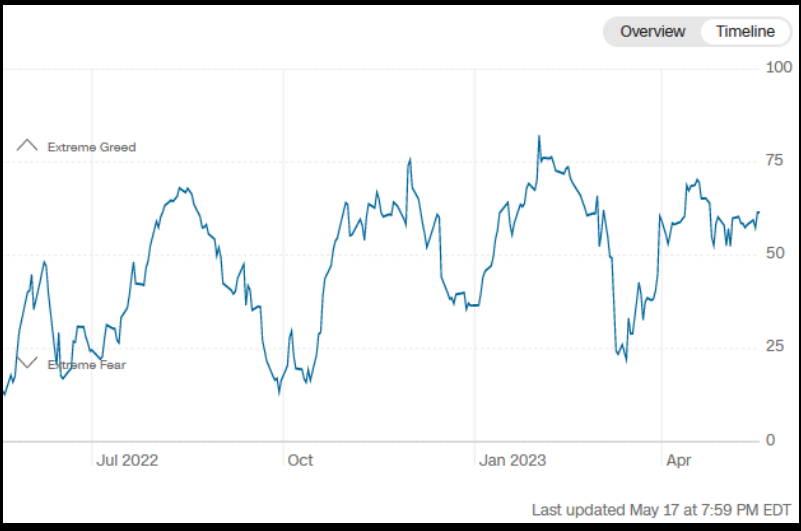
The CNN “Fear and Greed” ticked up from 60 last week to 61 this week. Sentiment is moving up. You can learn how this indicator is calculated and how it works here: (Video Explanation)
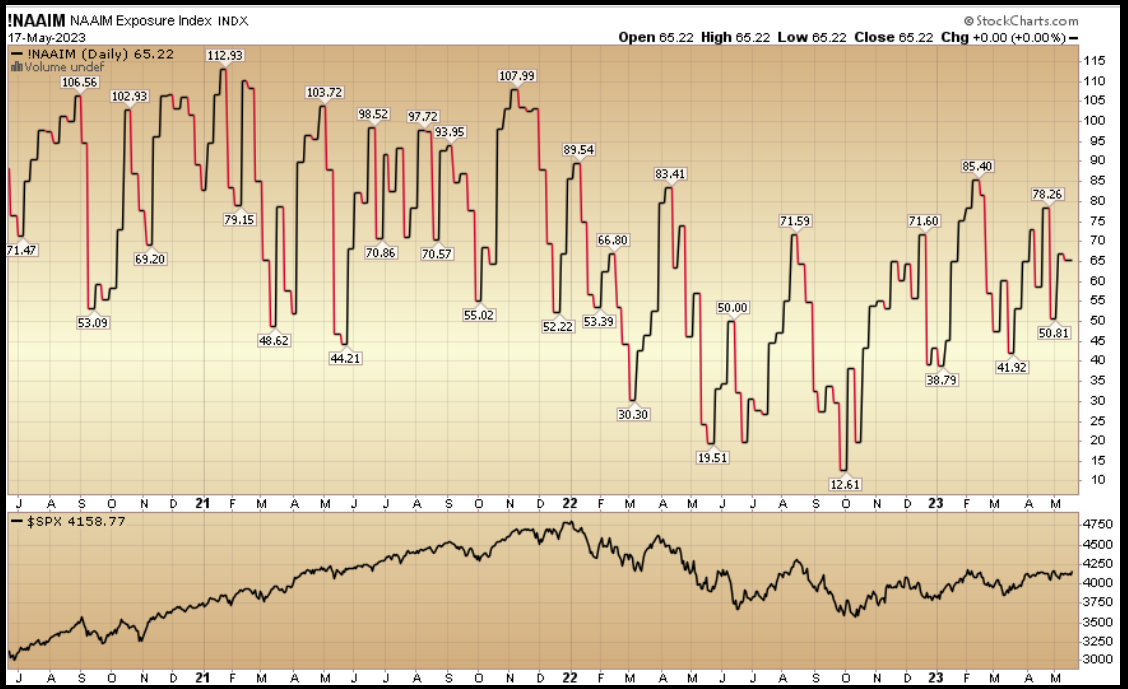
And finally, the NAAIM (National Association of Active Investment Managers Index) (Video Explanation) ticked down to 65.22% this week from 67.01% equity exposure last week.
This content was originally published on Hedgefundtips.com.
