
Stocks were lower last week, creating bearish engulfing patterns on the weekly charts. The most notable was on the S&P 500, which saw the body of the red candle completely overtake the body of the green candle from the week before.

This pattern was also present on the Invesco QQQ Trust (NASDAQ:QQQ).

The Dow Jones Industrial Average:

and the iShares Russell 2000 ETF (NYSE:IWM):

It was also present on the SPY to TLT ratio on the daily chart.

Additionally, this week saw confirmation of the bearish engulfing pattern on the daily chart on July 27.

These are bearish technical signals, and if they are confirmed with another down week suggests that there is probably more downside to this market. But more importantly, this past week, the short implied volatility dispersion trade showed signs of breaking down; we have been tracking this trade for some time.
This is a trade where a fund shorts the S&P 500 at the index level and goes long volatility on the components of the S&P 500 while also going long the underlying stocks. One tool to measure this trade is the one-month implied correlation index, which had a big week, rising to almost 21, after falling to levels not seen since late 2017 and the fall of 2018. This rising index suggests this short volatility trade is most likely in the process of falling apart.
One reason it is falling apart is that we are seeing rates rise rapidly, and the dollar is regaining momentum. The USD/CAD had a massive move this week and is on the cusp of breaking out and moving to 1.36.
The VIX appears to move with this USD/CAD trade, and when the USD/CAD rises, the VIX tends to move right along with it.
This was visible and on display on Friday when the USD/CAD started to rise around 12:45 PM ET.

Much of this dollar strength is coming from two sources, a better-than-feared US economy, which is causing many analysts to scrap their recession calls, and due to the BOJ raising the cap on the Japan 10-Year. Rates in the US have been moving higher right, along with rates rising in Japan.

If this trade continues to unwind, it will mean that the next level of support for the S&P 500 comes at a gap of around 4,440 and then 4,390.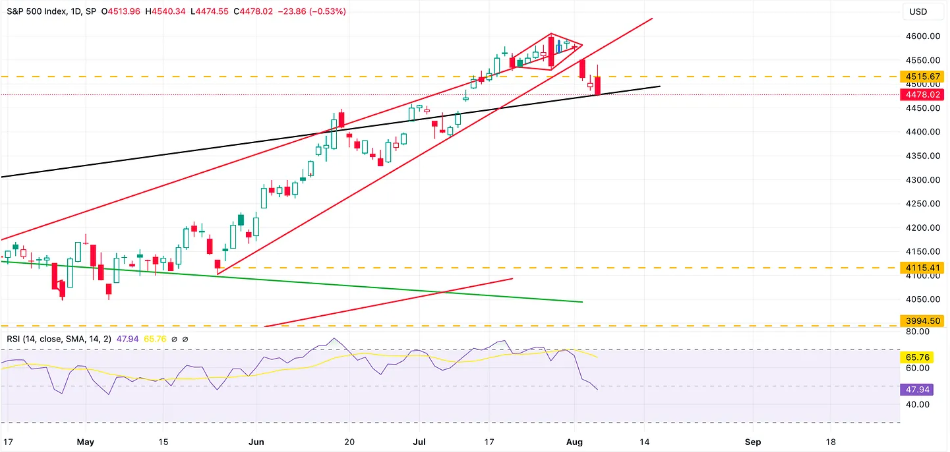
The QQQ has now failed two days in a row to get above resistance at $375, which is bearish because that price had previously served as support. This makes the next support level $368 and then $358.
But perhaps the most important of all is Apple's (NASDAQ:AAPL) significant drop last week. The stock fell below an uptrend that had been in place since early January. It was a very well-controlled rally on the way higher, and now that trend is broken. This could be the stock to watch because if Apple doesn’t recover, the entire short-volatility dispersion trade can’t work, leading to the trade unwinding further. Apple’s next big level of support doesn’t come until $175.
This week’s Free YOUTUBE video: