Get 40% Off
👀 👁 🧿 All eyes on Biogen, up +4,56% after posting earnings. Our AI picked it in March 2024.
Which stocks will surge next?
Unlock AI-picked Stocks

DXY Moving Higher, But How Much Further Can It Go?

Published 2020-01-07, 12:52 p/m
Updated 2023-07-09, 06:31 a/m

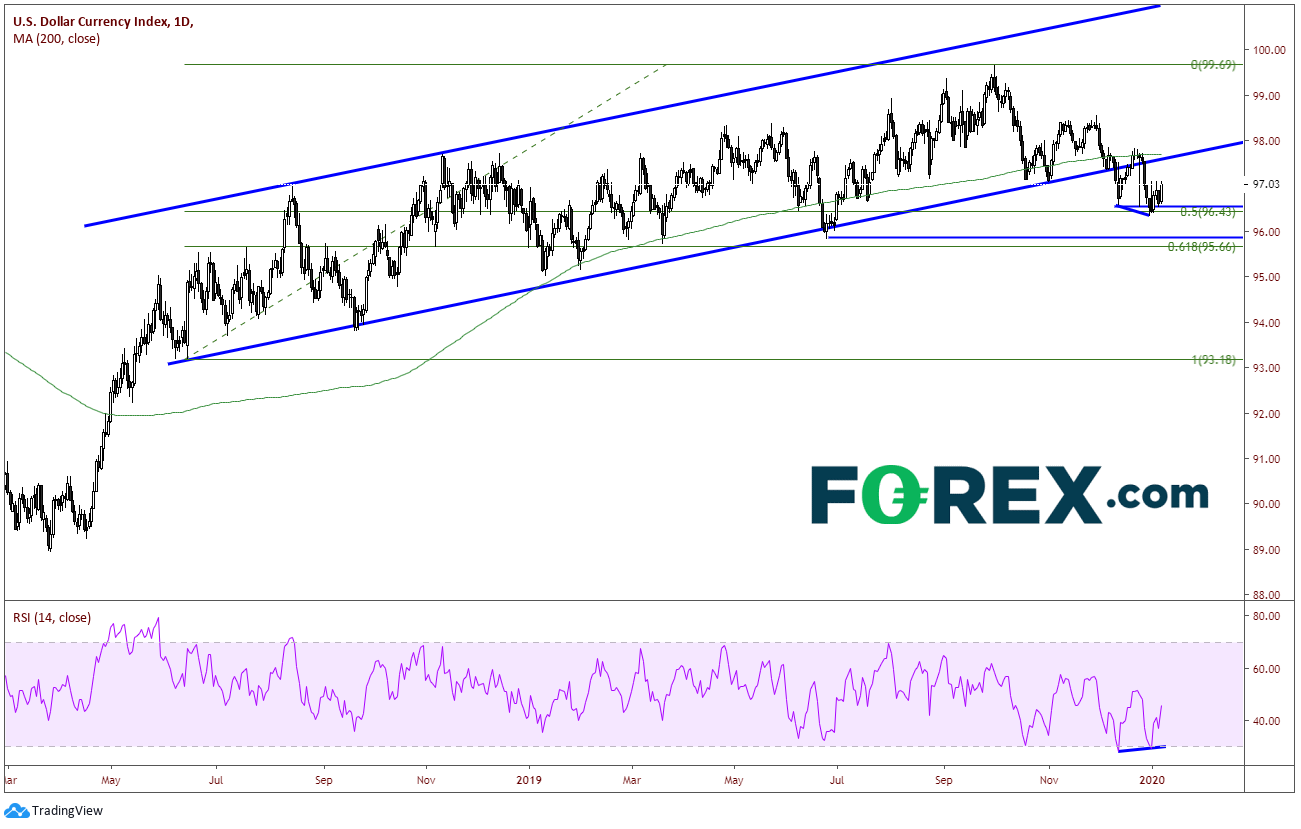
The US Dollar Index (DXY) has been in an upward sloping channel since early May of last year. Price hit a high of 99.67 on Oct. 1, 2019, and has pulled back to current levels near 97.00. There are several important technical indicators to take note of at the current point of the move lower:

1) During the pullback, DXY broke through the 200-Day Moving Average, which today come across at 97.69.

2) Price broke below the lower rising trendline of the upward sloping trendline.

3) DXY has attempted several times to break below the 50% retracement level from the beginning of the channel low at 93.19 to the Oct. 1 high at 99.67. This level is 96.43.

4) On a daily timeframe, towards the end of 2019 the DXY and the RSI began to diverge as the RSI put in higher lows as price put in lower lows. This indicates a possible reversal in price may be ahead.

Tradingview, FOREX.com

Today, DXY got the bounce, up almost +0.5%. However, one must consider how much higher price can go before pulling back. On a 240-minute chart, the DXY is currently near a triple top and fighting a band of resistance between 97.00 and 97.20. In addition, there is a large amount of resistance between 97.50 and 98.00 that the DXY must get through, and it doesn’t seem like it's going to be easy. There is horizontal resistance at 97.60, as well as a downward sloping trendline of the Oct. 1 highs, which comes across near the same level. In addition, there is the 38.2 Fibonacci retracement level and the 50% retracement level from the Oct. 1 high to the Dec. 31 lows.

3rd party Ad. Not an offer or recommendation by Investing.com. See disclosure here or remove ads .
Tradingview, FOREX.com

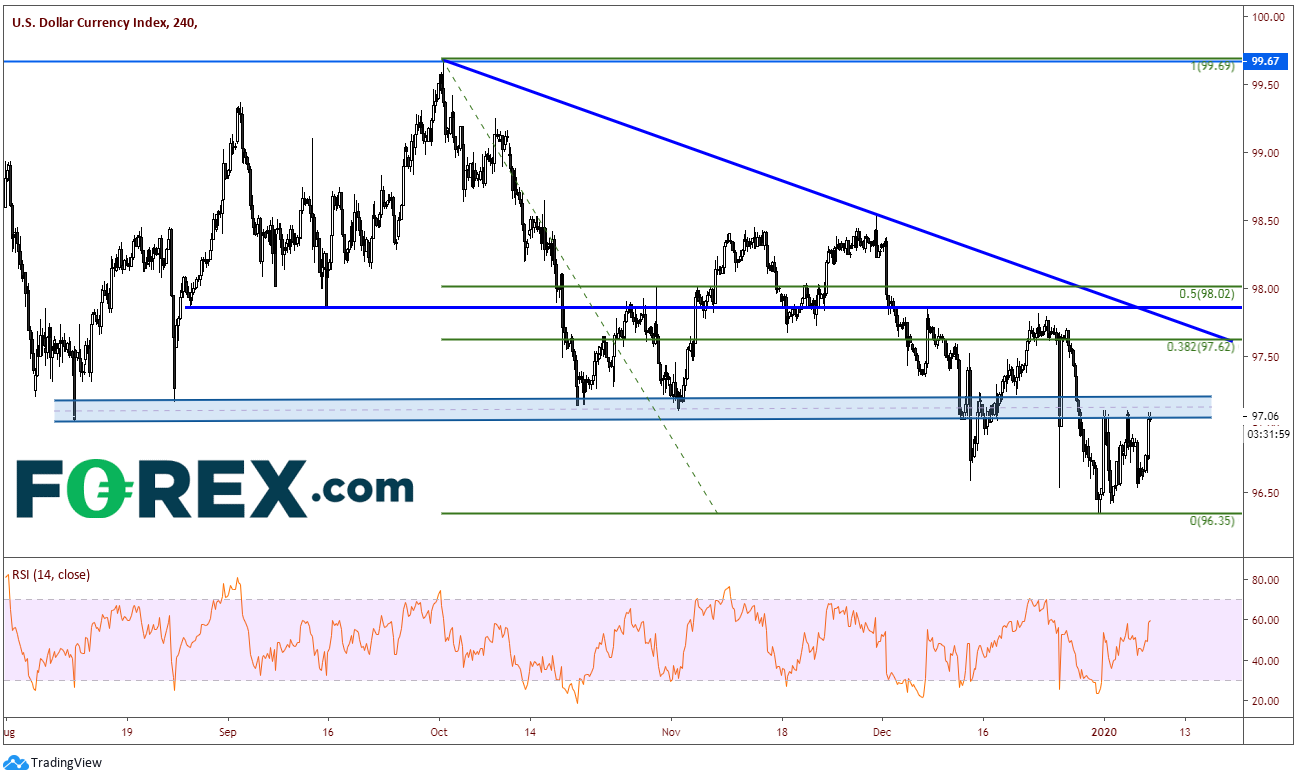
And keep in mind about the resistance from the daily chart, including a retest of the upward sloping trendline from the long-term channel and the 200-Day Moving average.

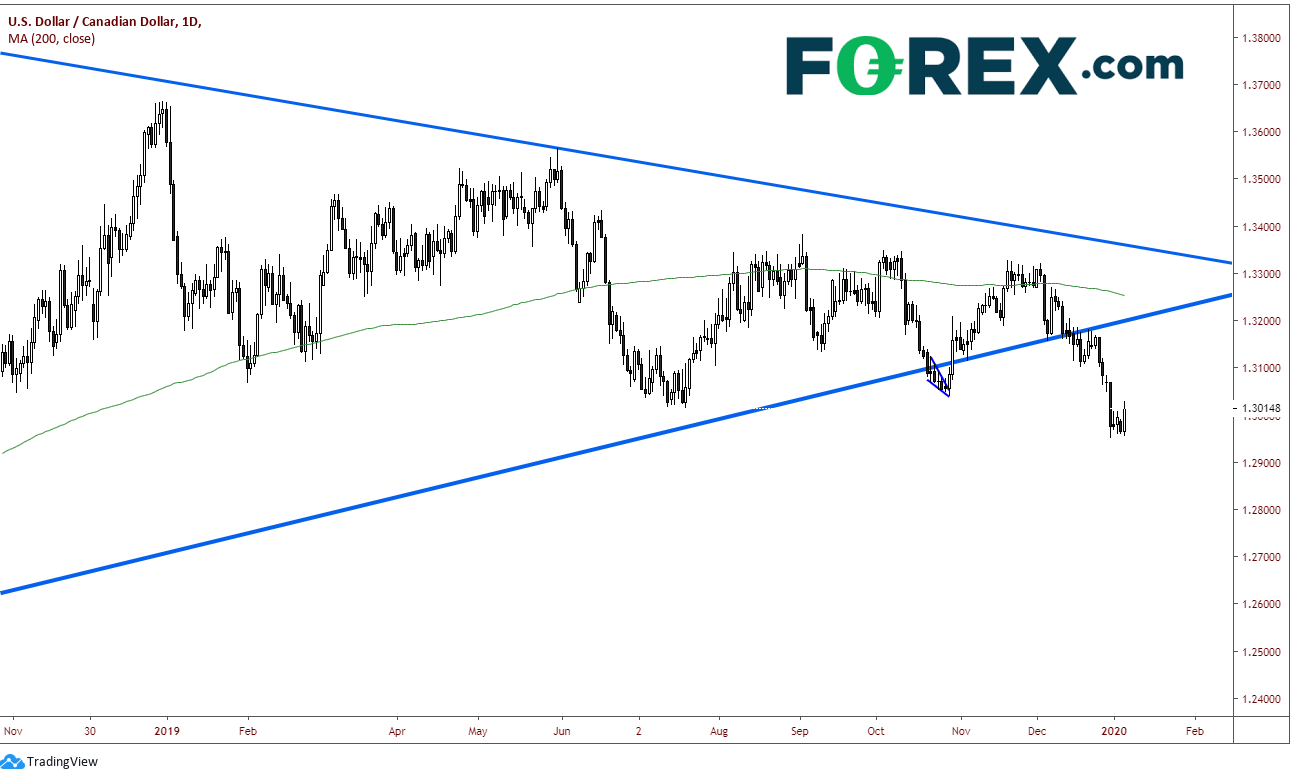
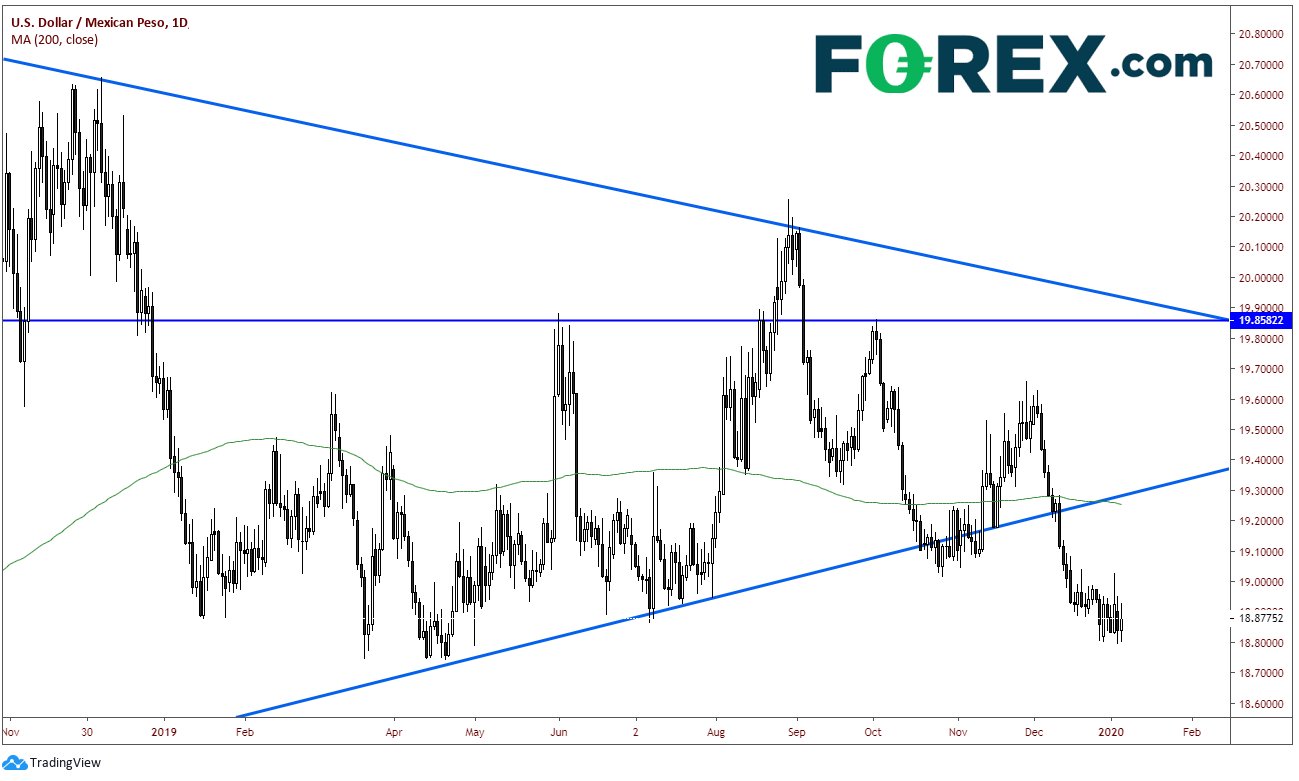
In addition, notice that recently USD/CAD and USD/MXN have broken down from their long-term triangles (which I have been writing about for the past few months) and are now consolidating below the upward sloping trendlines. Price in these two U.S. dollar pairs would also have to move back into their long-term triangles, which would pull DXY higher with them.

USD/CAD

Tradingview, FOREX.com

USD/MNX

Tradingview, FOREX.com

If the U.S. Dollar Index is going to make a significant move higher, it's going to have a lot of work to do.

If the U.S. Dollar Index is going to make a significant move higher, it's going to have a lot of work to do.

Latest comments

Risk Disclosure: Trading in financial instruments and/or cryptocurrencies involves high risks including the risk of losing some, or all, of your investment amount, and may not be suitable for all investors. Prices of cryptocurrencies are extremely volatile and may be affected by external factors such as financial, regulatory or political events. Trading on margin increases the financial risks.
Before deciding to trade in financial instrument or cryptocurrencies you should be fully informed of the risks and costs associated with trading the financial markets, carefully consider your investment objectives, level of experience, and risk appetite, and seek professional advice where needed.
Fusion Media would like to remind you that the data contained in this website is not necessarily real-time nor accurate. The data and prices on the website are not necessarily provided by any market or exchange, but may be provided by market makers, and so prices may not be accurate and may differ from the actual price at any given market, meaning prices are indicative and not appropriate for trading purposes. Fusion Media and any provider of the data contained in this website will not accept liability for any loss or damage as a result of your trading, or your reliance on the information contained within this website.
It is prohibited to use, store, reproduce, display, modify, transmit or distribute the data contained in this website without the explicit prior written permission of Fusion Media and/or the data provider. All intellectual property rights are reserved by the providers and/or the exchange providing the data contained in this website.
Fusion Media may be compensated by the advertisers that appear on the website, based on your interaction with the advertisements or advertisers.
© 2007-2024 - Fusion Media Limited. All Rights Reserved.