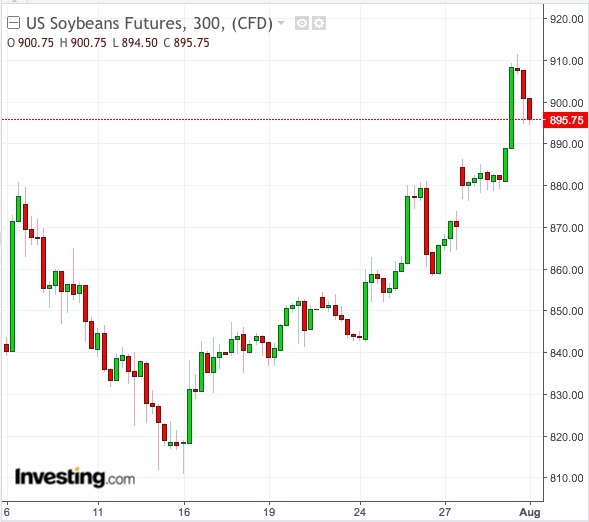
Just two weeks ago, Chicago soybean prices hit 10-year lows on China’s counter levy to US tariffs. This week, soy has outperformed everything from oil to copper on signs Beijing and Washington may resume talks to head off a growing trade war.
There's an inextricable bond between US soybeans and China that helps explain the recent price volatility on the Chicago Board of Trade.

CBOT soybean futures are up more than 3% on the week after a Bloomberg report on Tuesday that Representatives of Treasury Secretary Steven Mnuchin and Chinese Vice Premier Liu He were looking to restart trade talks following months of standoff. Only in mid-July, Chicago soy prices were down 25% from the year’s highs on concerns that relations between the two nations were worsening.
US Soy Exports Remain Strong
Equally important to this week’s recovery was data on Tuesday from the US Department of Agriculture showing Chinese buyers took 2.4 million bushels of soybeans last week, nearly half of all overseas sales.
US soybean cargoes for global shipment reached 27.2 million bushels last week, versus the prior week’s 26.8 million bushels and against trade estimates of 26.5 million bushels.
China purchased some $12.4 billion of soy from the US, or a third of the $34 billion the country spends a year in all on that commodity. Soybeans are the second-most valuable US export to China after a variety of airplanes.
Logically, the bullish tone set by data on Chinese imports should have been tempered by crop conditions for soy this year, with USDA surveys showing 70% of plantings in good-to-excellent condition. The pace of blooming at 86% and pod-setting at 60% are moderately better than last year’s numbers and five-year averages.
Moreover, a protracted US-China trade standoff could result in a flood of competitive Brazilian soy exports into China, further weakening CBOT prices. The Trump administration has already enacted a 25% tariff on roughly $34 billion of Chinese goods and is planning similar treatment on a further range of products worth $200 billion. The Chinese have responded with their own 25% tariff on US goods that include soybeans.
Brazilian Competition Overplayed
But long-time watchers of US agriculture say the impact of Brazilian competition to US soy prices has been overplayed, despite soybeans to be loaded in August at the Paranagua port fetching a premium of more than $2.20 a bushel to CBOT futures three weeks ago, the widest gap in four years.
“Beyond the fall season, Brazilian soy production will likely suffer from drought, making China dependent again on US supply,” said Shawn Hackett, grains commentator for Hackett Financial Advisors in Boynton Beach, Florida. “It makes sense for both the US and China to do a deal than to continue with their hostilities.”
USDA’s monthly report for July estimated that domestic farmers would lose some $325 million in new crop sales if this year’s soy price decline isn’t halted with a trade deal – underscoring the importance of China to the US market.
More Immediate Upside Than Downside
But with the current 6-week high of $9.1150 per bushel for CBOT soybeans still being 16% lower than April’s peaks, there appears to be more immediate upside to the market than downside.
Investing.com’s daily technicals have a “Strong Buy” on US soybean futures. Fibonacci patterns indicate resistance starting at $8.8464, then building to $8.7686 and eventually to $8.6425. The pivot was seen at $8.9725.
CBOT soy was also poised for a short-covering run that could lift prices, ADM Investor Services also said in Tuesday’s market outlook.
“Speculative funds are still carrying a healthy short position over 61,000 contracts and the forecast might give reason to exit,”’ ADM said. “With month end today, these traders will probably be more interested in liquidating rather than marking the close for month end.”
