A single tweet by Tesla's (NASDAQ:TSLA) co-founder and CEO Elon Musk, "Am considering taking Tesla private at $420. Funding Secured," was enough to propel shares of the electric car company higher on Tuesday.
Earlier, TSLA stock was enjoying gains at $342.57 following a Financial Times report that Saudi Arabia's sovereign wealth fund had invested $2 billion in the company. After Musk's surprise tweet—and subsequent confirmation—traders calculated that the $420 per-share buyout price marked a gain of 22.6%, or $77.43, from the current price, and raced to bid up the stock to $386.68, prompting a 12.93% intraday jump .
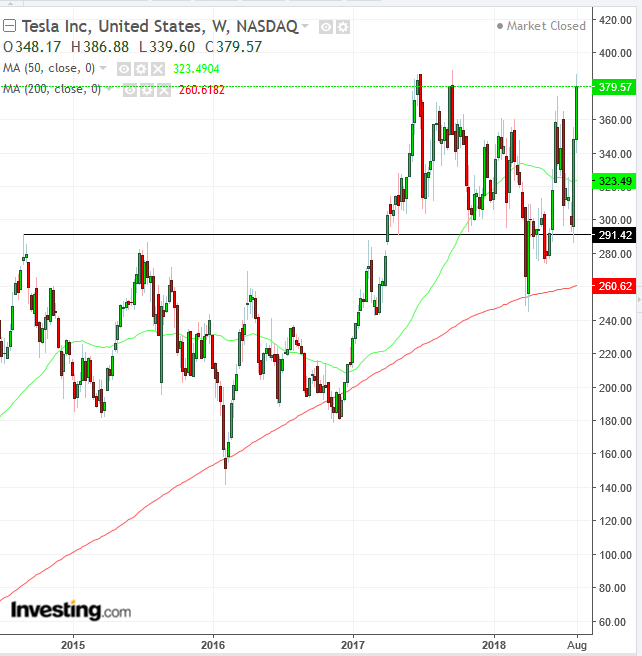
But some critics accuse Musk of stock manipulation and pointed out that his company’s $3.2 billion debt makes his plans unviable. Looking at the technical chart, these very arguments might explain why the stock price stumbled upon a resistance line below its all-time high.

The intraday high stopped $2.72 or 0.7% below Tesla's all-time high of $389.61, posted Sept. 18. This suggests that sellers don't think the share price will be able to overcome that level.
The 50 DMA (green) crossed above the 200 DMA (red), executing a golden cross, after the FT report. The technical event is said to demonstrate that current price averages are outperforming earlier price averages. But savvy traders know that moving averages require movements to indicate anything meaningful. The company has been moving sideways for more than a year, invalidating the bullish implication of the golden cross.
We believe that a tweet is not reliable guidance, especially when it lacks details. So, yesterday’s stock surge should be considered nothing more than a knee-jerk reaction by traders, while fundamentally nothing changed. In other words, we expect the record proximity is unwarranted and shorts will only increase.
For traders who wish to go long on the chance of an upside breakout, beware of a bull trap with this volatile stock. Avoid taking a long position unless the stock shows sustainable support, at least with a close above the $400 key level.
Trading Strategies
Conservative traders are likely to stay out of this stock, until it enters a discernable trend, above or below its 14-month sideways move, between $380 and $250.
Moderate traders may wait for a confirmation of the resistance at the $390 level, with a solid red candle.
Aggressive traders might risk a short, providing they establish an equity management plan with a 1.3 minimum risk-reward ratio that recognizes that the price could rise to $390, even without the breakout.
Short Trade Example
- Entry: $380
- Stop-loss: $390
- Risk: $10
- Target: $300, above $290 2014 resistance turned to general support May 2017 and psychological round number
- Reward: $80
- Risk-Reward Ratio: 1:8
