Global stocks are on the rise today. So are US equity futures, including the Dow.
The US and China have come to a truce on trade, at least for the next 90 days. As well, Fed Chief Jerome Powell has indicated that rate hikes going into 2019 may slow.
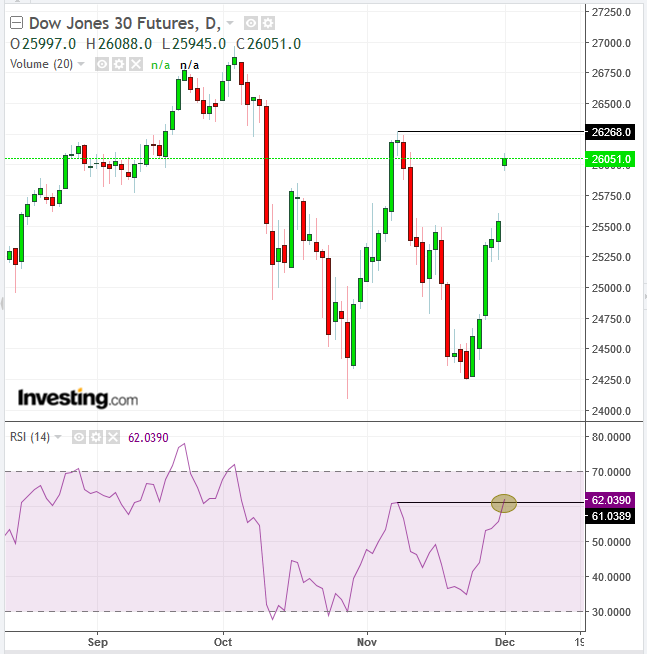
We, however, have forecast that stocks will resume their consolidative course, which has been in force since their October records. It may be noteworthy that even as US futures joined the global equity euphoria, they've stayed away from challenging the early-November peaks.
While this is no guarantee that stock traders will pick up where futures traders left off and take US indices higher later today, it does increase the probability that the previous peak is either a psychological resistance or that there is an actual cluster of supply waiting to dump their contracts and shares on newly-minted market optimists.
The pause in the trade tiff should be most beneficial for the Dow. The 30 mega cap multinational corporations listed on the index rely heavily on foreign markets to keep profits growing.

Still, even this contract, which jumped as high as 2.00, did not scale above the previous peak's 26,268 price level.
The RSI is peaking above its previous high, which corresponds to the price peak mentioned above. Should the indicator manage to remain at this level, 62 and up, it would provide a positive divergence, suggesting prices will follow momentum higher.
However, should the RSI fall back below the 62 level, it would project a failed rally, underlying the resistance of the 26,268 price level. Still, the fact that Dow futures suggest their underlying benchmark will open close to but below the previous peak’s resistance affords an exceptional contrarian trade from a risk-reward perspective, since the way down toward the bottom of the consolidation is much longer than the way up.
Note: check with your broker regarding slippage, when the price of an instrument jumps over your stop-loss, which is therefore not triggered. Should that be the case, your loss will be calculated according to the next price quoted on the exchange.
Trading Strategies – Short Position Setup
Conservative traders should wait for a clear trend with both medium-term and long-term peaks and troughs heading in the same direction.
Moderate traders may risk a short position after prices confirm the previous peak’s resistance.
Aggressive traders may short immediately or after noticing steam running out of bulls.
Trade Sample:
- Entry: 26,000
- Stop-loss: 26,300, above the previous peak
- Risk: 300 points
- Target: 24,500, above the resistance of the October, November lows
- Reward: 1,500 points
- Risk-Reward Ratio: 1:5
Bonus Strategy:
Lock in profits by splitting positions at the 25,000 round psychological level or by moving the stop-loss there. At that level, the reward would already be 1,000 points, or 1:333. Everything else would be gravy.
