CNBC and the financial press love all-time highs. What else would you put on the front page on a day that all is well in the world and the U.S. stock market is at all-time highs? The story writes itself when the market arbitrarily prints a few points above some prior arbitrary print.
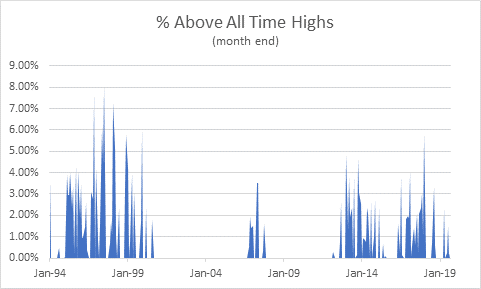
When we read all time highs, we tend to think of the market grinding higher over hundreds of years where it seems nearly every print is a new all-time high. But is that really how it works? A look at how often the stock market (using S&P 500 total return index) has been at new all-time highs over the past 25 years shows that it isn’t as smooth of a ride as we might expect. If it was, there would be consistent blue spikes from left to right in that chart.

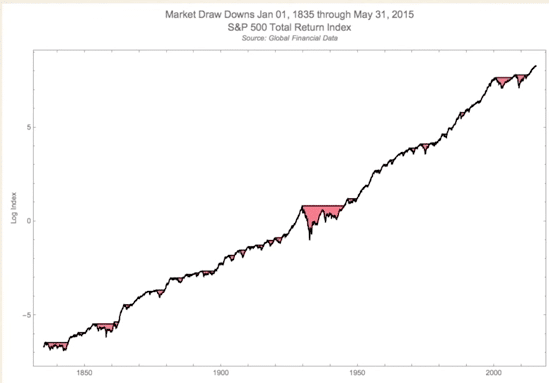
Another way to look at it is from the drawdown side. Here’s a graph of the S&P 500 total return index from Ben Carlson’s wonderful post highlighting that stocks have been moving up and to the right since the early 1800s (but with some rather noticeable drawdown periods).

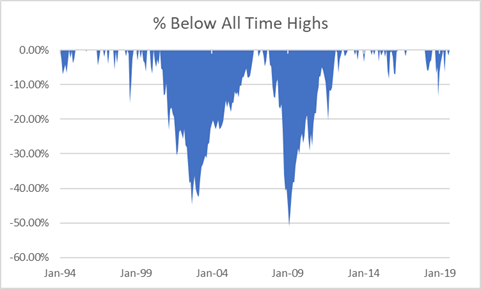
To make the visuals easier to see just how bad those red areas are, take a look at the opposite of the first chart shown above. Take a look at the percentage Below all-time highs chart, otherwise known as an underwater equity chart.
(Disclaimer: Past performance is not necessarily indicative of future results.)
But we’ll submit here that drawdowns are by far the more nefarious risk enemy. Drawdowns, both their size and their duration, are what keep you up at night and can take you out in a stretcher the next day. Drawdowns are the amount of money you are down before the investment makes new highs, and the amount of time you’re down before making new highs.
There’s an awful lot of those red spots along that line. The most noticeable red is during the Great Depression right around the middle of the graph, followed by the dot-com bubble and the housing bust up in the top right. Still, it looks like you spend more time out of drawdown than in it. But not so fast, my friends.
Here’s Carlson explaining:
Stocks don’t make new highs every single day, so most of the time you’re going to be underwater from your portfolio’s high-water mark. This means there are plenty of chances to be in a state of regret when investing in stocks. This makes sense when you consider that stocks are positive just a little over half the time when looking at returns on a daily basis, but it can be difficult to wrap your head around this fact.

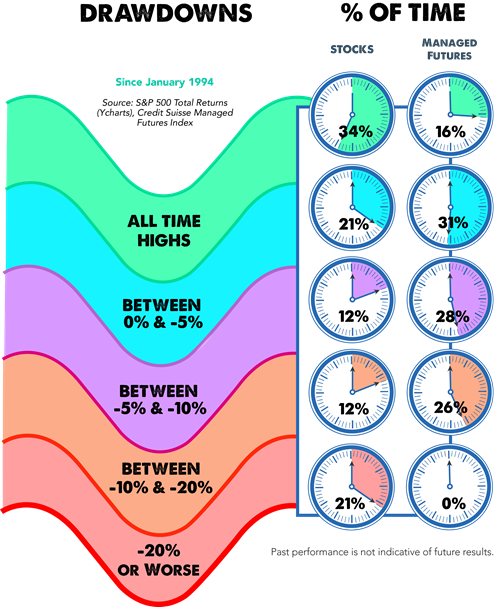
You can see here that the instances of being ‘underwater’ or much more frequent and evenly spaced than the amount of time that you are equity highs, leading to that too often feeling (as Carlson points out) that your investment portfolio just isn’t getting the job done. In fact, over the past 25 years (since January 1994), stocks have been at all-time highs just 34% of the time, while in some sort of drawdown the rest of the time (64%).

A word on skew. We’ve put the Credit Suisse (SIX:CSGN) managed futures index alongside the stock drawdown timing clocks above to highlight an important difference between investment profiles for short volatility type investments like stocks and long volatility type alternative investments like managed futures. Stocks are a classic example of trading off
a. better metrics in that top ‘clock’, getting a higher percent of time at all-time highs grinding higher,
for b. accepting larger than normal losses and a worse looking ‘clock’ at the bottom of the table (-20% or more losses). These larger than should be expected losses given the median skew the return profile to the left (negatively).
Conversely, the long vol managed futures profile is nearly an opposite look, whereby the top all-time highs ‘clock’ has a much lower reading (returns and all-time highs aren’t nearly as consistently seen) in exchange for a healthy 0 on the bottom ‘clock’. Long vol products skew returns to the right, away from the outsized losses, at the expense of small gains now.
Neither is right or wrong. They just are. But just think about that for a minute. Over the past 25 years, stocks have spent 21% of the months down more than -20%. A fifth of the time has been downright scary. While the alternative investment has spent 75% of the time being “meh,” but none of the time being truly scary. This is what non correlation and different return profile look like in the real world – nuanced, 25-year look back, differences in how returns are delivered.
