U.S. Q3 Earnings: Winners, Losers, Lessons For Q4 And 2016
Investing.com | Dec 14, 2015 04:53
By Jesse Cohen
As Q3 2015 earnings season winds down, and with investor awareness mostly focused elsewhere for the duration--on global growth concerns and prospects of a Fed rate hike—this third-quarter earnings season appears to have slipped somewhat under the radar.
But for those paying attention, there were some notable surprises and disappointments, and perhaps a few growing signs of specific industry—and economic—paradigm shifts.
So who were the biggest winners and losers of the season? And what were some of the key themes that influenced corporate balance sheets?
Bleak Overall Picture
In total, 1,522 of the companies on Wall Street beat earnings expectations in the third-quarter, a 59.3% beat rate.That sounds pretty impressive, till you consider this additional fact: 785 stocks missed estimates this season, a 30.6% miss rate. Plus, 260 companies reported earnings that simply met expectations.
In comparison, during the same period last year, a whopping soon hit parity , falling from $1.09 today.
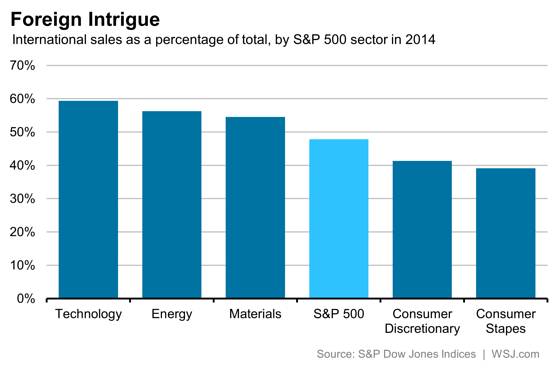
In addition, feeble global growth prospects will further weigh on earnings, especially for multinational corporations which do the bulk of their business abroad. Companies with less exposure to foreign sales will continue to do better through year-end and into 2016.
Q4 And Beyond: Potential Winners and Losers
For the fourth quarter of 2015, I expect earnings of consumer discretionary stocks and consumer staples, such as Amazon, Home Depot (N:HD), Nike (N:NKE) and Starbucks (O:SBUX), to outperform, while industrials which are sensitive to the global growth outlook, like Caterpillar (N:CAT) and Deere (N:DE) will underperform.
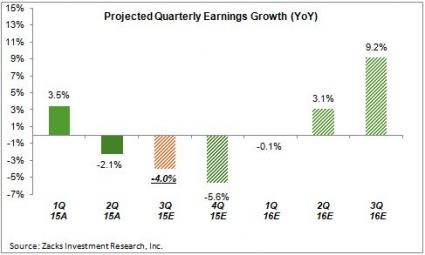
Looking further ahead into 2016, current projections point to yet another quarter of negative earnings growth, before stabilizing and turning higher in Q2 of next year.
U.S. Indices: SPX - Exhausted Bull; NDX - Relentless Uptrend
A technical examination of the S&P 500 vs. the NASDAQ 100 charts suggests that the technology sector may outperform in Q4 in comparison to the rest of the market.
On the S&P 500 Index monthly chart, above, a doji candle has formed just below a fresh supply zone, and the big drop we witnessed this past August indicates that there are still many sellers around the 2100 level.
At the time we went to press, it seems that the yearly candle for 2015 will look like a doji cross, purple in the chart below:
This candle formation—after a long uptrend—could signal the end of the seven good years the market has experienced since the 2008 crisis.
If Q4 reports disappoint as many analysts expect, or merely signal that the moment has come to pull out and wait for better times, we may see the S&P index testing the demand zone again (after having tested it earlier this year, in August and September). A break below 1820 (the base of the weekly demand zone) will open the way for further losses—with the first target around 1560, where a resistance area has turned to support.
If Q4 reports surprise to the upside, and offer hope for better results in 2016, and if the interest rate is kept low enough, the S&P 500 Index may breach the aforementioned supply zone around 2135, which then (again) opens the way for new, never-before-explored, highs.
However, the current sideways movement, which has been a hallmark of market activity during the fall, alongside lower volume and a 7-year-long uptrend, all increase the chances of a coming corrective move.
The story is a bit different for the NASDAQ 100. The index has consumed the seller's area between 4700 and 4200, and it relentlessly continues its uptrend around the highs of March 2000 (4780-4800), above. At the moment it’s strongly possible that it will close above these highs, but unless a firm demand zone is formed, new highs could be a mere 'false break'.
Around these historical levels, investors are advised to keep an eye on the weekly and monthly charts for warning signs in the form of reversal candles and patterns.
At the moment, it looks like the yearly candle is about to close as a bullish hammer (unless price drops through month-end), which by itself inside an uptrend means nothing but continuation.
The decreasing volume could signal some weakness, but it hasn't stopped the NASDAQ 100 from going all the way back up. Therefore, we still expect the technology sector to show strong reports for Q4 and perhaps even into Q1 '16.
Trading in financial instruments and/or cryptocurrencies involves high risks including the risk of losing some, or all, of your investment amount, and may not be suitable for all investors. Prices of cryptocurrencies are extremely volatile and may be affected by external factors such as financial, regulatory or political events. Trading on margin increases the financial risks.
Before deciding to trade in financial instrument or cryptocurrencies you should be fully informed of the risks and costs associated with trading the financial markets, carefully consider your investment objectives, level of experience, and risk appetite, and seek professional advice where needed.
Fusion Media would like to remind you that the data contained in this website is not necessarily real-time nor accurate. The data and prices on the website are not necessarily provided by any market or exchange, but may be provided by market makers, and so prices may not be accurate and may differ from the actual price at any given market, meaning prices are indicative and not appropriate for trading purposes. Fusion Media and any provider of the data contained in this website will not accept liability for any loss or damage as a result of your trading, or your reliance on the information contained within this website.
It is prohibited to use, store, reproduce, display, modify, transmit or distribute the data contained in this website without the explicit prior written permission of Fusion Media and/or the data provider. All intellectual property rights are reserved by the providers and/or the exchange providing the data contained in this website.
Fusion Media may be compensated by the advertisers that appear on the website, based on your interaction with the advertisements or advertisers.