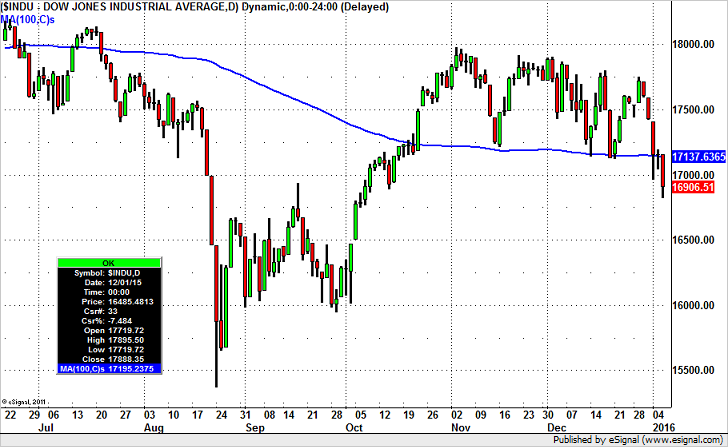
This Dow Chart Scares Me
Kathy Lien | Jan 06, 2016 18:07
By Kathy Lien, Managing Director of FX Strategy for BK Asset Management.
Chart Signals More Losses For Currencies
Currencies and equities faced another day of losses as mixed U.S. data, FOMC minutes, China fears and North Korea’s nuclear test wrecked havoc on the financial markets. The Dow Jones Industrial Average fell more than 250 points pushing many currencies lower. Risk aversion is in full swing and a very strong nonf on Friday is needed to turn sentiment around. The Oil price fell 5% to its lowest level in 11 years as the selling spread to commodities. It's an all-out bloodbath with many investors desperate to know when the losses will ease.
Unfortunately the following chart of the Dow signals more weakness in equities and currencies. For the first time since October, the DJIA closed below the 100-day SMA. The last time this happened was in July, just before the decline that eventually took the index below 15500. Since currencies have been tracking equities, if U.S. stocks continue to fall -- the next level of support for the Dow is 16500 -- many currencies will see fresh losses as well. The big winners will be the Japanese yen and the U.S. dollar but for no reason other than a flight to safety.

The December FOMC minutes raised concerns about the future path of tightening. After raising interest rates at the last meeting, the central bank’s optimism led investors to believe that they intend to hike again in the first quarter. However the minutes revealed that the decision was a “close call” for some as opposed to a clean unanimous vote like the original FOMC statement suggested -- and there was “significant concern” over low inflation. So Friday’s NFP report is exceptionally important because future tightening really does depend upon incoming data. But lets be clear -- no one expects the Fed to hike in January. After this Friday’s release, there will still be 2 more NFP reports before the March meeting, so traders shouldn’t make too much of the upcoming release -- unless it is shockingly weak or strong. According to Wednesday’s reports, private payrolls rose strongly in December with the ADP Employment Change ticking up 257K from 211K. Although service-sector activity slowed, the employment index edged higher.
Meanwhile, the euro did not fall against the U.S. dollar. It appears that the currency's recent weakness is finally paying off with the Eurozone’s service and composite PMI numbers revised higher for December. There’s no doubt that we have been seeing improvements in European data but Europe faces tremendous economic, political, social and geopolitical risks in the coming year. Wednesda’s rebound has taken EUR/USD just shy of 1.08, a key resistance level that we expect to hold.
Wednesday's worst-performing currency was the Australian dollar, which lost another 1 percent versus the greenback. Although gold prices rebounded, service-sector activity expanded at its slowest pace in more than a year. This week’s additional Australian and Chinese economic reports pose a continued risk to AUD/USD.
USD/CADraced to fresh 12-year highs, Wednesday, as oil sank to 11-year lows. The correlation between CAD and oil has been in excess of 90% these days and for good reasons because oil is Canada’s number-1 export. The decline in crude prices completely overshadowed Wednesday’s better-than-expected trade data. Canada reported an unexpectedly significant improvement in the its trade deficit thanks to the first increase in exports in 3 months. Sales of motor vehicles and parts rose 5.9% while sales of metals and non-metallic minerals rose 20.5%. The weakness of the Canadian dollar has helped boost non-energy exports, which needs to continue if Canada is to avoid recession. The IVEY PMI report is scheduled for release Thursday and economists are still looking for weakness. The New Zealand dollar also extended its losses on the back of risk aversion and lower commodity prices.
Service-sector activityin the U.K. slowed, driving sterling lower versus the greenback. Despite the improvement in construction-sector activity, services and manufacturing saw weakness at the end of the year, which caused the composite index to fall to 55.3 from 55.7. We believe GBP/USD is poised to test its 2015 low at 1.4566
Trading in financial instruments and/or cryptocurrencies involves high risks including the risk of losing some, or all, of your investment amount, and may not be suitable for all investors. Prices of cryptocurrencies are extremely volatile and may be affected by external factors such as financial, regulatory or political events. Trading on margin increases the financial risks.
Before deciding to trade in financial instrument or cryptocurrencies you should be fully informed of the risks and costs associated with trading the financial markets, carefully consider your investment objectives, level of experience, and risk appetite, and seek professional advice where needed.
Fusion Media would like to remind you that the data contained in this website is not necessarily real-time nor accurate. The data and prices on the website are not necessarily provided by any market or exchange, but may be provided by market makers, and so prices may not be accurate and may differ from the actual price at any given market, meaning prices are indicative and not appropriate for trading purposes. Fusion Media and any provider of the data contained in this website will not accept liability for any loss or damage as a result of your trading, or your reliance on the information contained within this website.
It is prohibited to use, store, reproduce, display, modify, transmit or distribute the data contained in this website without the explicit prior written permission of Fusion Media and/or the data provider. All intellectual property rights are reserved by the providers and/or the exchange providing the data contained in this website.
Fusion Media may be compensated by the advertisers that appear on the website, based on your interaction with the advertisements or advertisers.