Qualcomm's Recent Strong Earnings Growth Is Unlikely To Boost Its Valuation
Geoff Considine, Ph.D | Jan 11, 2022 08:49
- QCOM shares leapt after a big earnings beat at the start of November
- The shares have lagged the semi industry substantially over the past 12 months
- The company is poised for substantial growth in auto market applications
- The Wall Street consensus outlook is bullish
- The market-implied outlook for 2022 is moderately bearish
Qualcomm (NASDAQ:QCOM) is a major provider of semiconductor chips and related software and services, principally for mobile computing and communications. The company is positioning itself to lead in high-growth applications in the auto industry (via the company’s 1.5% dividend yield, the consensus for 12-month total return is about 15.9%.
This is slightly lower than QCOM’s 2021 total return and far below the trailing 3- and 5-year annualized returns. Whether or not the consensus outlook for total return is attractive depends on how risky the next year looks, a topic I address in the next section.
Market-Implied Outlook for QCOM
I have calculated the market-implied outlook for QCOM for the 5.2-month period from now until June 17, 2022 and for the 12.3-month period from now until Jan. 20, 2023, using the prices of options that expire on these two dates.
The standard presentation of the market-implied outlook is in the form of a probability distribution of price return, with probability on the vertical axis and price return on the horizontal.
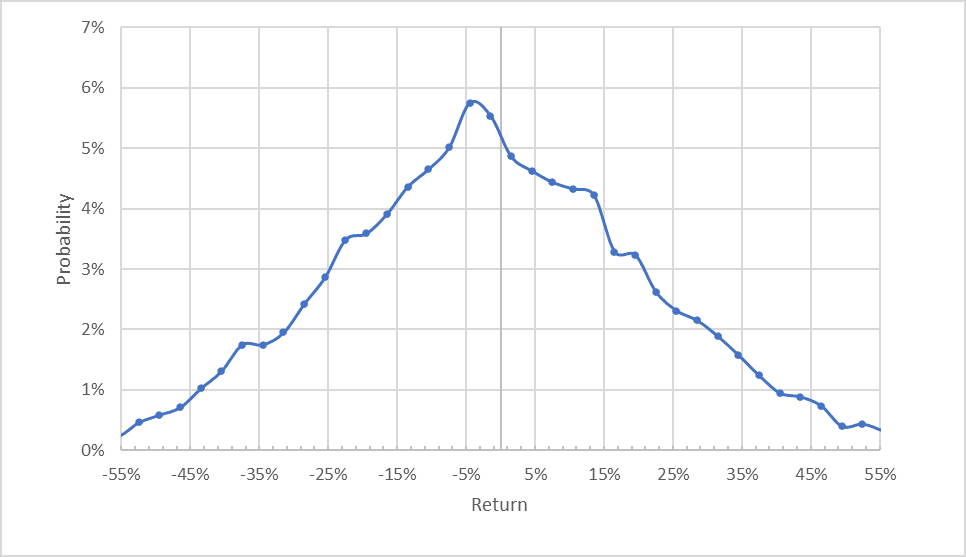
Source: Author’s calculations using options quotes from E-Trade
The market-implied price return probabilities for QCOM until the middle of 2022 are generally symmetric, with comparable probabilities of positive and negative returns of the same magnitude, although the maximum probabilities slightly favor negative price returns.
The peak probability corresponds to a price return of -4%. The annualized volatility calculated from this distribution is 42.7%. This level of volatility is quite close to the value from the market-implied outlook in March of 2021.
To make it easier to directly compare the probabilities of positive and negative returns, I rotate the negative return side of the distribution about the vertical axis (see chart below).
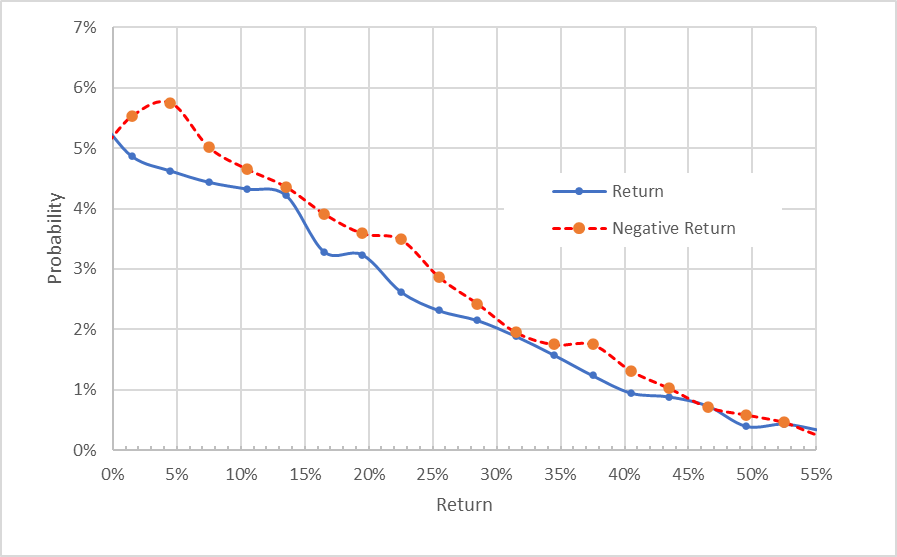
Source: Author’s calculations using options quotes from E-Trade. The negative return side of the distribution has been rotated about the vertical axis.
This view shows that the probabilities of negative returns are consistently, albeit mildly, elevated relative to the probabilities of positive returns of the same magnitude (the red dashed line is above the solid blue line). On its face, this would seem to indicate a bearish outlook, but we expect that market-implied outlooks may have a negative bias. Because, in aggregate, investors are expected to be risk averse, they are likely to pay more than fair value for downside protection (put options). This, in turn, would create a negative bias in the market-implied outlook. As such, this market-implied outlook for QCOM is best interpreted as neutral.
Looking all the way through 2022, calculating the market-implied outlook using options that expire on Jan. 20, 2023, the view is more bearish. The spread in probabilities to favor negative returns is more pronounced (the red dashed line is further above the solid blue line).
While it is not possible to robustly estimate the potential size of the risk aversion bias in the market-implied outlook, the tilt to favor negative returns is now large enough that I interpret it as bearish. That said, the apparent bearish tilt is considerably less pronounced than it was back in March. The annualized volatility calculated from this distribution is 39.6%, almost identical to the value I calculated in March.
Source: Author’s calculations using options quotes from E-Trade. The negative return side of the distribution has been rotated about the vertical axis.
The market-implied outlook is neutral to mid-2022 and somewhat bearish for the full year. The expected volatility is fairly stable at about 40% (annualized).
Summary
QCOM has successfully grown EPS over the past several years. The qualitative outlook for the company is favorable, with hardware and software that powers increasingly autonomous vehicles. In addition, the company has a strong position in mobile processors.
That said, QCOM has substantially underperformed the Semiconductor industry over the past 12 months, indicating that the market has concerns about the forward-going value proposition. The Wall Street consensus rating for QCOM is bullish and the consensus 12-month price target implies 15.9% in total return.
With expected volatility of 40%, however, 15.9% in return is not terribly attractive. As a rule of thumb for a buy, I want to see an expected 12-month return that is at least half the expected volatility and QCOM does not quite reach this level.
The market-implied outlook is neutral to the middle of 2022 and moderately bearish for the full year. With the shares trading near their all-time highs, I am maintaining my neutral rating on QCOM. A caveat is that I underestimated the firm in my last analysis using the same approach.
Trading in financial instruments and/or cryptocurrencies involves high risks including the risk of losing some, or all, of your investment amount, and may not be suitable for all investors. Prices of cryptocurrencies are extremely volatile and may be affected by external factors such as financial, regulatory or political events. Trading on margin increases the financial risks.
Before deciding to trade in financial instrument or cryptocurrencies you should be fully informed of the risks and costs associated with trading the financial markets, carefully consider your investment objectives, level of experience, and risk appetite, and seek professional advice where needed.
Fusion Media would like to remind you that the data contained in this website is not necessarily real-time nor accurate. The data and prices on the website are not necessarily provided by any market or exchange, but may be provided by market makers, and so prices may not be accurate and may differ from the actual price at any given market, meaning prices are indicative and not appropriate for trading purposes. Fusion Media and any provider of the data contained in this website will not accept liability for any loss or damage as a result of your trading, or your reliance on the information contained within this website.
It is prohibited to use, store, reproduce, display, modify, transmit or distribute the data contained in this website without the explicit prior written permission of Fusion Media and/or the data provider. All intellectual property rights are reserved by the providers and/or the exchange providing the data contained in this website.
Fusion Media may be compensated by the advertisers that appear on the website, based on your interaction with the advertisements or advertisers.