For Long-Term Superior Returns And Diversification, Try An Equal-Weight ETF
Investing.com | Feb 22, 2021 05:33
Equal-weighted exchange-traded funds (ETFs) invest equal amounts of money in companies irrespective of their market capitalizations (caps). As such, a firm's market cap does not matter. The ETF invests the same amount of money in all the companies in the index.
As most of our readers would know, to calculate the market cap, one would multiply the number of shares outstanding by the current share price. For example, a company with 50 million shares selling at $20 a share would have a $1 billion market cap.
Over the past several decades, capitalization-weighted indexing has become the dominant industry standard for passive investment. In a cap-weighted index, a firm with larger market cap would have a more significant impact on the index value.
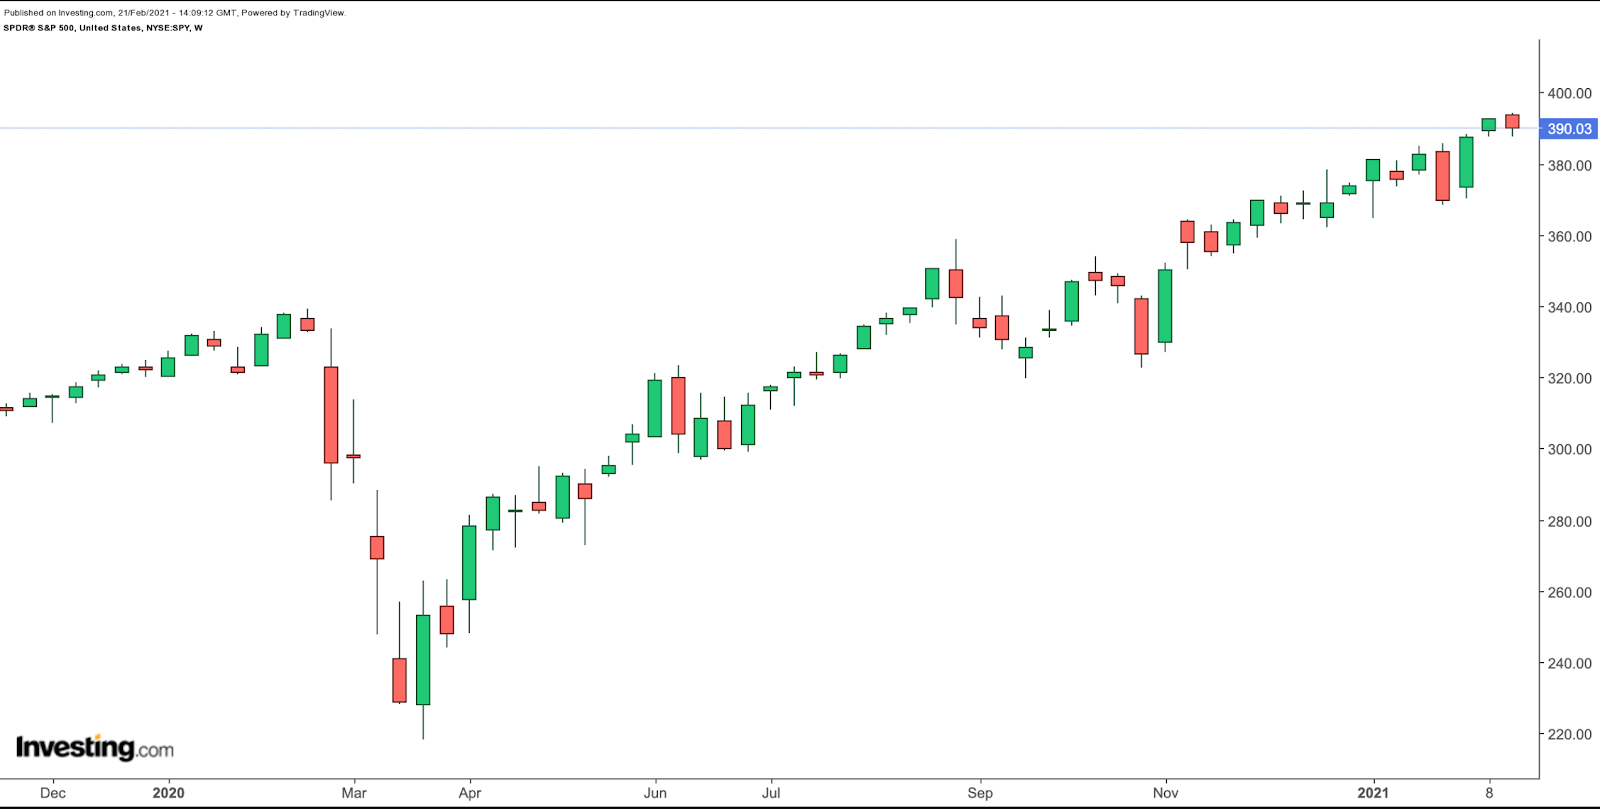
For instance, the S&P 500, an important barometer of the US stock market's performance, is a market-cap-weighted index. The SPDR® S&P 500 (NYSE:SPY) provides exposure to the index. Apple (NASDAQ:AAPL), whose market cap is $2.18 trillion, has the highest weighting (6.27%) in SPY, followed by Microsoft (NASDAQ:MSFT) and Amazon (NASDAQ:AMZN). The top ten names in the ETF comprise close to 30% of the fund.
On the other hand, other names with smaller market caps have less allocation in SPY. For instance:
- PayPal (NASDAQ:PYPL) — market cap: $336.0 billion, weighting: 1.03%;
- Coca-Cola (NYSE:KO) — market cap: $215.3 billion, weighting: 0.59%;
- Starbucks (NASDAQ:SBUX) — market cap: $121.6 billion, weighting: 0.37%;
- General Motors (NYSE:GM) — market cap: $75.7 billion, weighting: 0.37%;
- Delta Air Lines (NYSE:DAL) — market cap: $29.1 billion, weighting: 0.085%;
- Kellogg (NYSE:K) — market cap: $19.9 billion, weighting: 0.045%;
- Gap (NYSE:GPS)) — market cap: $9.0 billion, weighting: 0.014%.
S&P Global (NYSE:SPGI) cites:
"The percentage return of a capitalization-weighted index tells us the percentage change in the aggregate value of all the stocks in the index. No other weighting scheme produces this result. The percentage return of an equally weighted index, for example, tells us the return of the average stock, but not the change in the value of the entire stock market."
Despite the importance of cap-weightings for appreciating the stock market's performance, highlights , "equal-weighted portfolios ... appear to outperform various other portfolio strategies."
With that information, here's an ETF that may appeal to readers looking to diversify their portfolios in the coming weeks.
Invesco S&P 500 Equal Weight ETF
- Current Price: $135.60
- 52-Week Range: $70.56 - $136.03
- Dividend Yield: 1.54%
- Expense Ratio: 0.2%
The Invesco S&P 500® Equal Weight ETF (NYSE:RSP) tracks the returns of the S&P 500 Equal Weighted Index, which equally weights the stocks in the S&P 500 Index. Both the fund and the index are rebalanced quarterly.
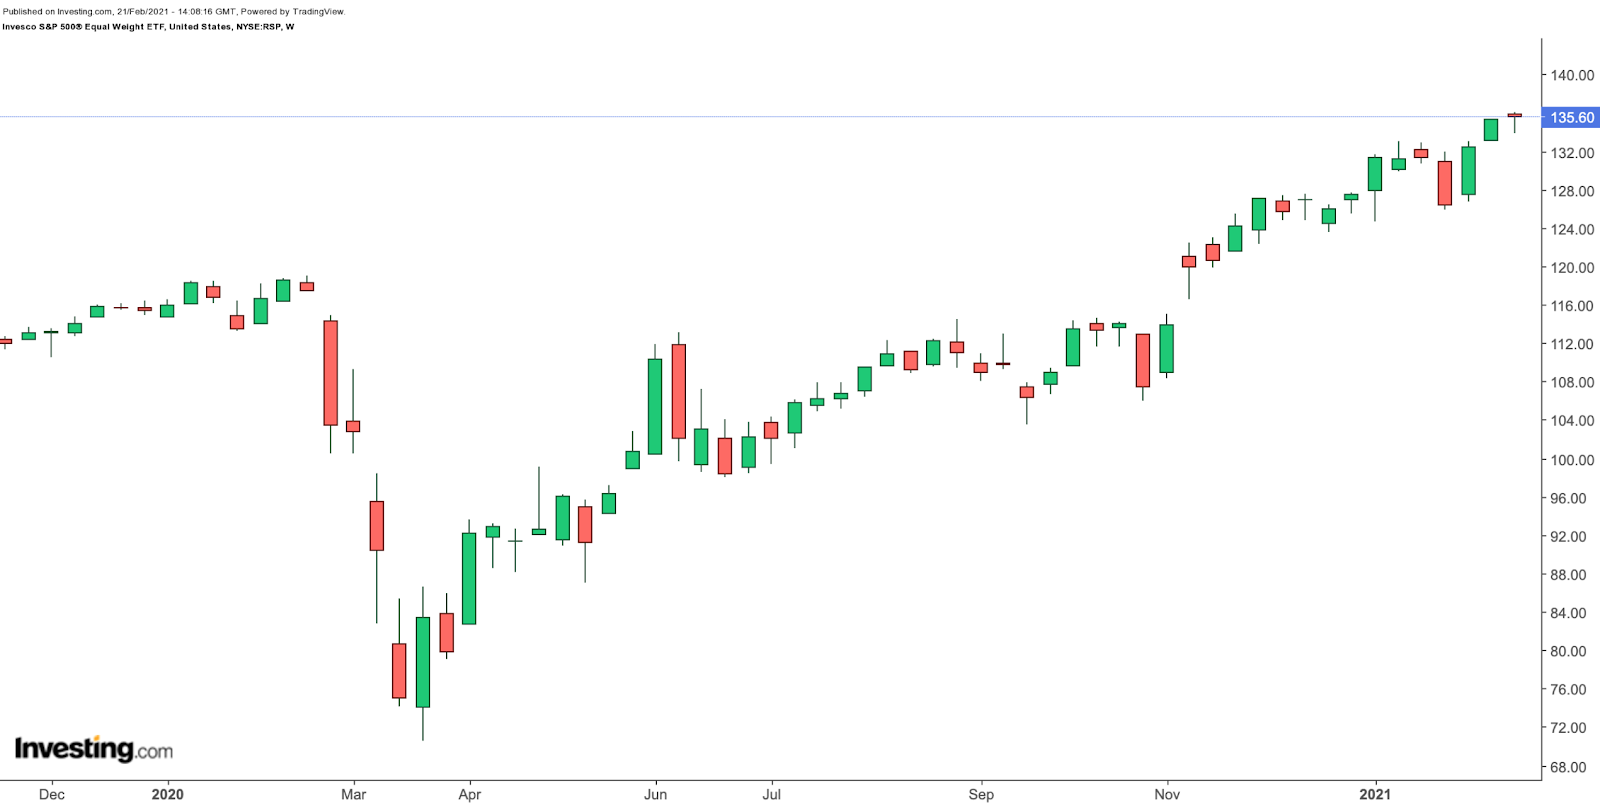
RSP, which started trading in April 2003, has over $20 billion in assets under management. At present, the top ten stocks comprise 2.67% of the fund. The top three names are the global media and entertainment group ViacomCBS (NASDAQ:VIAC), SVB Financial Group (NASDAQ:SIVB) and Illumina (NASDAQ:ILMN), which focuses on DNA sequencing. By comparison, the ETF has allocated 0.20%, 0.21%, and 0.20% of funds in AAPL, MSFT, and AMZN.
Over the past year, RSP has returned 14.26%. Year-to-date (YTD), it is up 6.32% and hit a record high on Feb 16. On the other hand, SPY returned 15.28% and is up 4.32% YTD. SPY also hit an all-time high Feb. 16.
What can the difference between the YTD returns of RSP and SPY tell us? In the months following the 52-week lows seen in March 2020, large-cap and growth stocks led broader markets higher.
However, in the past several months, we have been seeing a shift toward more small-cap and value stocks. Historically, in the long-run, these businesses have outperformed growth and large-cap stocks. Therefore, this move by investors is likely the main driver behind the stronger performance of RSP, highlighting the importance of diversification by investing in equal-weighted funds, too.
Bottom Line
There are other equal-weighted ETFs that might be of interest to readers. Such funds take away the market cap bias and give an equal shot to each firm within the index. These ETFs include:
- ETFMG Prime Cyber Security ETF (NYSE:HACK) — up 5.66% YTD
- First Trust NASDAQ-100 Equal Weighted Index Fund (NASDAQ:QQEW) — up 6.59% YTD;
- Invesco WilderHill Clean Energy ETF (NYSE:PBW) — up 16.32% YTD;
- Robo Global® Robotics and Automation Index ETF (NYSE:ROBO) — up 14.68% YTD;
- SPDR® S&P Bank ETF (NYSE:KBE) — up 18.1% YTD;
- SPDR® S&P Biotech ETF (NYSE:XBI) — up 12.99% YTD;
- SPDR® S&P Semiconductor ETF (NYSE:XSD) — up 15.9% YTD;
- The 3D Printing ETF (NYSE:PRNT) — up 42.04% YTD.
We plan to cover them in the future.
Trading in financial instruments and/or cryptocurrencies involves high risks including the risk of losing some, or all, of your investment amount, and may not be suitable for all investors. Prices of cryptocurrencies are extremely volatile and may be affected by external factors such as financial, regulatory or political events. Trading on margin increases the financial risks.
Before deciding to trade in financial instrument or cryptocurrencies you should be fully informed of the risks and costs associated with trading the financial markets, carefully consider your investment objectives, level of experience, and risk appetite, and seek professional advice where needed.
Fusion Media would like to remind you that the data contained in this website is not necessarily real-time nor accurate. The data and prices on the website are not necessarily provided by any market or exchange, but may be provided by market makers, and so prices may not be accurate and may differ from the actual price at any given market, meaning prices are indicative and not appropriate for trading purposes. Fusion Media and any provider of the data contained in this website will not accept liability for any loss or damage as a result of your trading, or your reliance on the information contained within this website.
It is prohibited to use, store, reproduce, display, modify, transmit or distribute the data contained in this website without the explicit prior written permission of Fusion Media and/or the data provider. All intellectual property rights are reserved by the providers and/or the exchange providing the data contained in this website.
Fusion Media may be compensated by the advertisers that appear on the website, based on your interaction with the advertisements or advertisers.