A Bear Market Could Last Much Longer Than Expected
Avi Gilburt | Mar 21, 2023 03:54
For those who have followed me through the years, you would likely remember at least one of the many major market directional calls we have made in many different markets. And while this list is clearly not all-inclusive, it does represent some of the market calls recently cited by our clients as the ones that most stick out in their memories:
- July of 2011: Called for rally in DXY from 73 with target of 103.53 while the Fed was pumping QE into the market and everyone was expecting a dollar crash. Market rallied initially to a target of 103.82 before a multi-year pullback, as we expected.
- August of 2011: Called for a top in gold at $1,921 while gold was going through a parabolic rally. Also called for downside target of the $1,000 region before it even topped. Market topped within $6 of our topping target (and then dropped to within $50 of our downside target).
- September 2015: Rolled out the EWT Mining Stock service, and started suggesting buys on stocks like Barrick Gold (NYSE:GOLD) (at $7) and Newmont Mining (NYSE:NEM) (at $16) despite many believing we were "crazy."
- December 2015: Called for a major bottom in gold the night we struck the bottom, despite the market turning extremely bearish at the time and expecting a break down below $1,000.
- December 2015: Called for a market top in the 2100SPX region, to be followed by a pullback towards 1800, and followed by a "global melt-up" to at least 2600SPX "no matter who gets elected" in 2016. Market bottomed at 1810, and began a strong rally to 2872.
- November 2018: Called for a bottom in TLT in the 112/113 region, with the expectation of a larger rally to follow. TLT bottomed at 111.90, and rallied to 179.70, despite the Fed still strongly raising rates at the time it bottomed.
- November/December 2019: Called for a 30% correction in the first quarter of 2020. We began the Covid Crash in February of 2020.
- March 2020: Called for a major market bottom at 2200SPX, with an expectation of a rally to at least 4000SPX. Market bottomed within 8 points of our target.
- April 2022: Suggested to cash in most of our NEM position (bought in 2015 at $16) in the $84/85 region. NEM topped at 86.37, and proceeded to drop 57% immediately thereafter.
The reason I bring this up is that at each and every one of these market turns, the general perspective of most market participants at the time was that the market would never follow our expectations and would continue on the same trajectory. The market sentiment was so ingrained in the current cycle that most simply were unable to see beyond their linear perspectives at the time.
Yet, markets do not move linearly. So, one must ask why so many maintain linear perspectives about how they expect a market to move. This leads me to the issue I want to address this week, which is a much bigger-picture discussion than you normally see from me.
On the bigger horizon, my expectation is that we are heading into a bear market that will last a minimum of 5-8 years but which has the potential to last as long as two decades. But, before I discuss this, I want to provide some amount of qualification.
First, I still have not seen absolute evidence that this degree of a bear market has indeed begun. Rather, I still think there is some potential that we can rally over 5000SPX before that bear market begins in earnest. And I am assuming the rest of 2023 will likely make this issue a settled matter. Should the market make it very clear later this year that the long-term bear market has indeed begun, then I think we will all have to change our mindsets as to what the future holds sooner rather than later.
But, even if the market is able to muster one more rally to new all-time highs, I am still expecting a much larger bear market to take hold thereafter, as I just noted above. Second, once we are in a confirmed long-term bear market, I cannot ascertain whether it will last as long as two decades until we are approximately 6-9 years into the bear market.
Yet, I get tremendous pushback from many commenters about my expectation for the potential of a 20-year bear market. Here is an example that is quite typical of the common perception of how the stock market works:
[T]he broad stock market has never gone down and stayed down... ever. I am happy with investing and staying invested. It has worked well for my clients... these last 42 years... Unless the entire USA disintegrates, the market will go higher over time. Always has... always will.
This is a person who supposedly has 42 years of experience. Well, you can even go back further, and you would see that he is generally right. The stock market has generally been in an upward trajectory over the last 100 years. And the longest bear market we have experienced in modern history was from 2000-2009. So, my expectation for a 5-8 years bear market is not terribly outlandish to most.
Yet, what about my view on the potential that this can take us as long as two decades? Are you going to assume it cannot happen simply because it has not happened in modern times? Are you viewing the market from a purely linear perspective? Do financial markets move linearly?
While my initial expectations from years ago were that S&P 500 would rally from the pullback I expected into the 2200SPX region into the 5000-6000SPX region before this long-term bear market began, there is quite a bit of potential that the long-term bear market may have already begun earlier than I had initially expected. As I noted above, the rest of 2023 will likely tell that story. But nonetheless, I believe that a long-term bear market is coming.
Let's look at our 100+ year chart of the S&P 500:
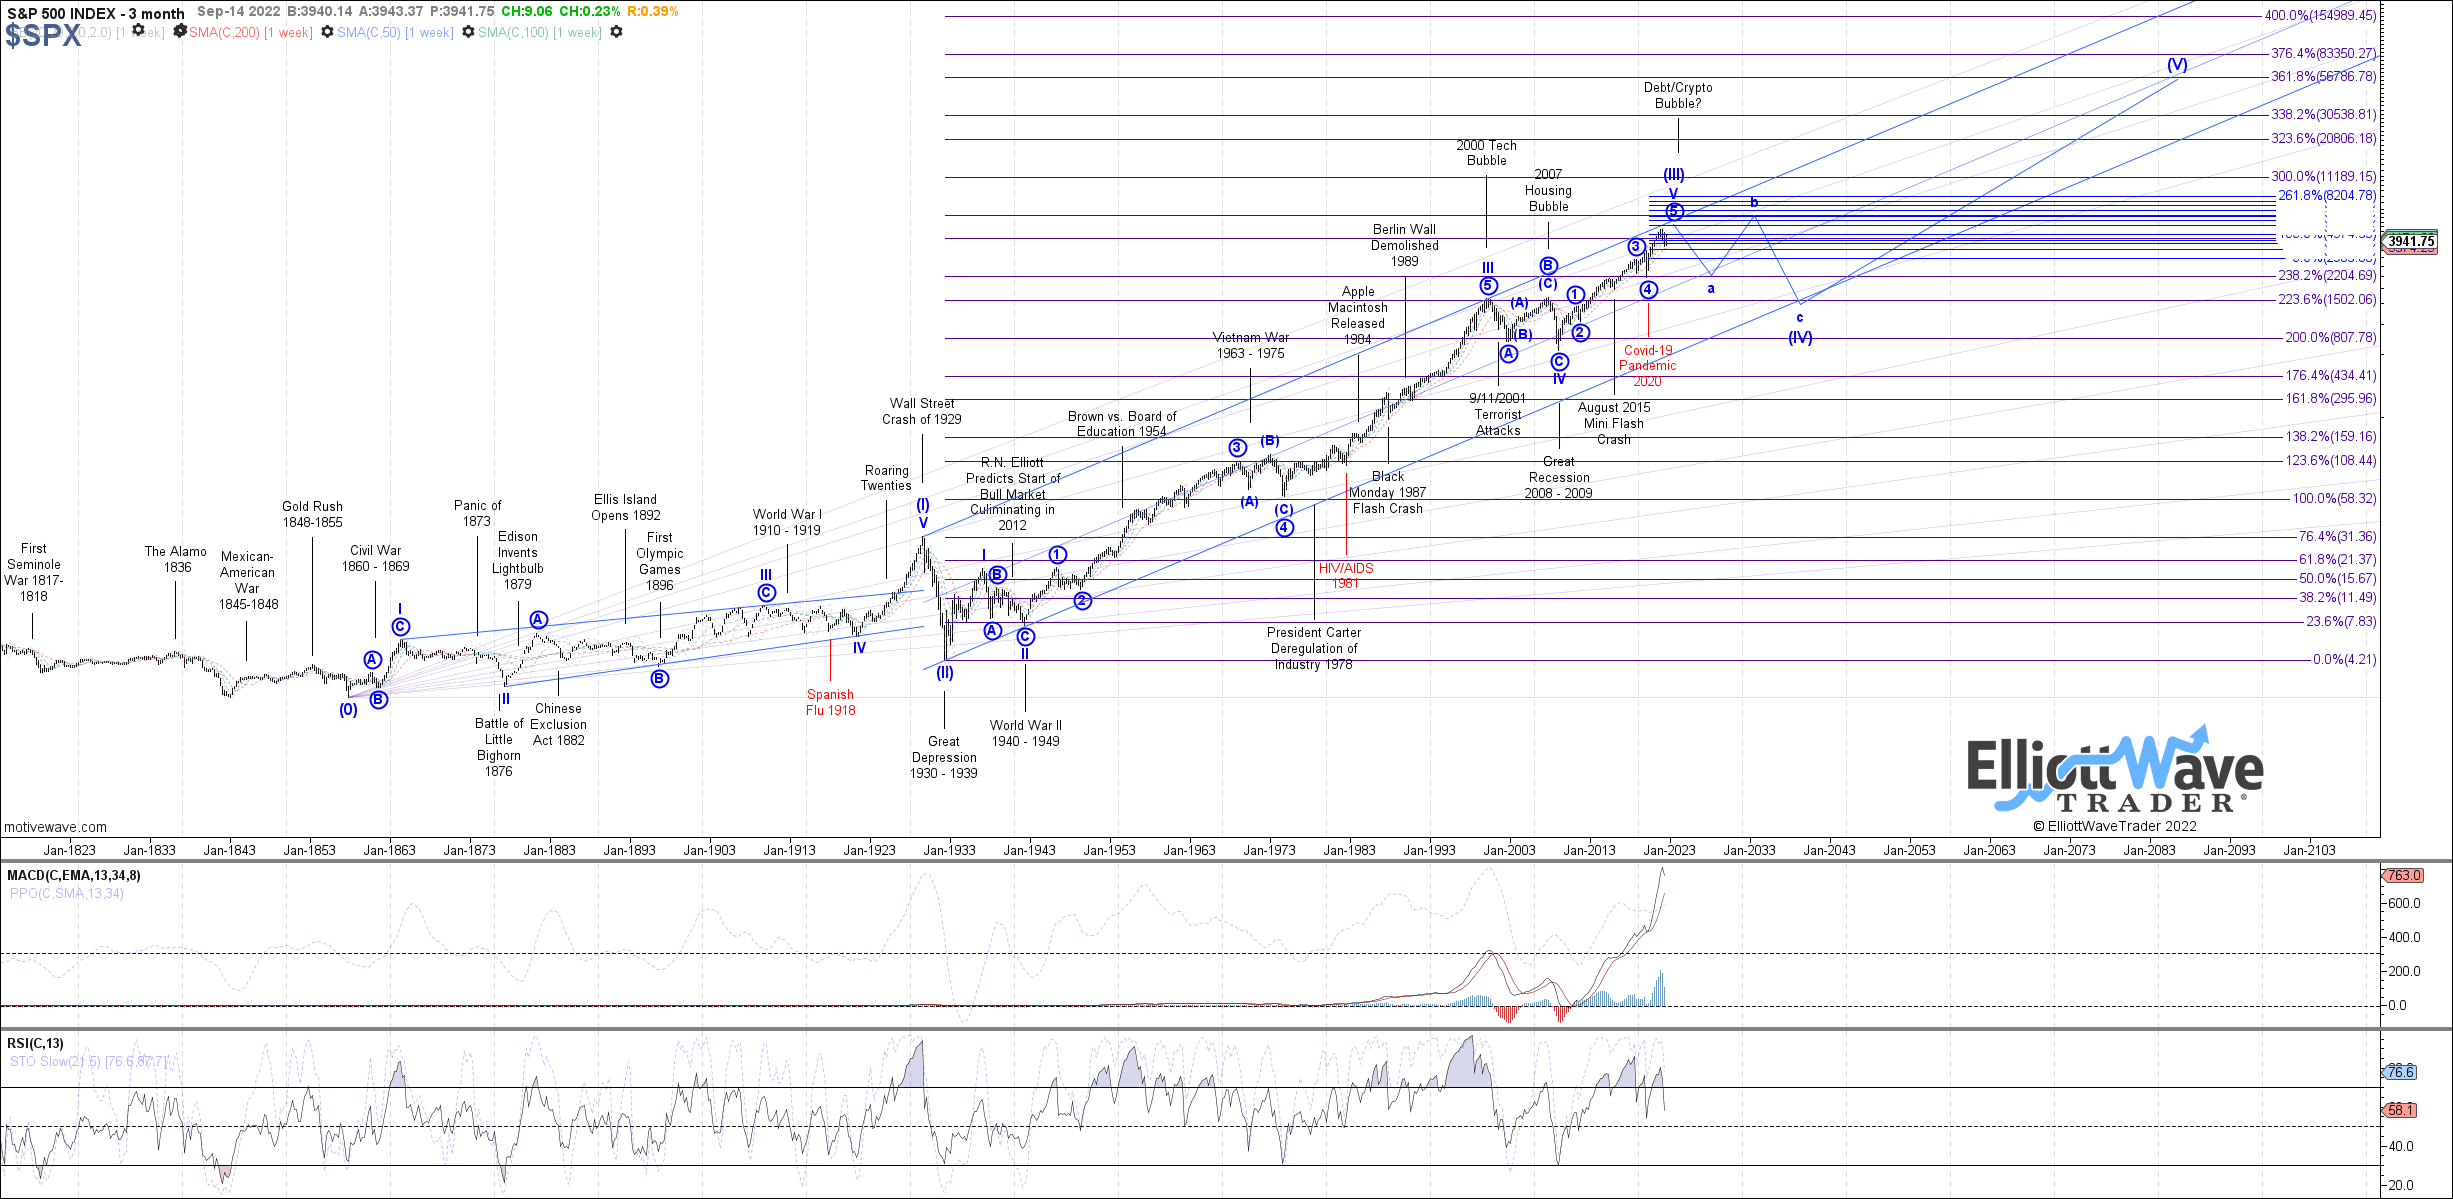
Source: Elliottwavetrader.net
Let me reiterate my perspective on why we are due for a very long-term bear market. And I will quote what I wrote from one of my prior articles:
I want to begin with a market call made back in 1941. In 1941, with world War II raging around him, Ralph Nelson Elliott penned the following market prognostication:
"[1941] should mark the final correction of the 13 year pattern of defeatism. This termination will also mark the beginning of a new Supercycle. . ., comparable in many respects with the long [advance] from 1857 to 1929. [This] Supercycle is not expected to culminate until about 2012."
For those of you that do not understand this quote, Elliott was predicting the start of a 70-year bull market in the face of World War II raging around him. Quite an amazing prediction, even if he was off by a decade. Still, if we do top out in the coming several years, he would be approximately 88% accurate in his prognostication. I have personally never seen a market prognostication in my lifetime that has been anywhere near as amazing as Elliott's back in 1941. And, again, consider the time in which he made this prediction, and how silly it must have sounded at the time.
In standing upon the shoulders of giants, I am potentially seeing the culmination of this very long-term bull market, and the emergence of a major bear market, the likes of which has not been seen in modern times.
You see, the crash which was seen in 1929 was a wave [II] bear market, whereas we are now moving towards the completion of that 100-year wave [III] bull market. And, once wave [III] completes, it will usher in a wave [IV] bear market.
Now, in Elliott Wave analysis, there is something called the theory of alternation. It suggests that if the 2nd wave was a sharp and fast correction, then the 4th wave of the same degree will likely be a long and drawn-out event. Since the wave [II] which ushered in the Great Depression was a relatively short spike down, then I can reasonably assume that wave [IV] can be a long and drawn-out event.
So, when taking all these factors into consideration, I think it is reasonable to expect that, once we complete wave [III] in the coming several years, we will usher in a long and drawn-out bear market in wave [IV], which is the same wave degree as the wave [II] which ushered in the Great Depression. Maybe we need to expect the Greater Depression based upon these expectations. . .
I, for one, do not see the market as a linear environment. That is one of the most valuable lessons that Elliott Wave analysis has taught me. Moreover, one of the most powerful aspects of Elliott Wave analysis is that it provides us with market context, which I have not similarly found in any other type of analysis methodology. This current market context is providing us with a 100+ year perspective.
George Santayana once noted that "those who do not learn from history are doomed to repeat it." I strongly urge us all to take the lessons learned from the similarities seen between the time frame prior to the Great Depression and our current market structure.
Now, I want to go back again to a point I made when I began this article. When it comes down to it, I am neither a perma-bull nor a perma-bear. Rather, I simply want to be on the correct side of the market at all times. Therefore, I am simply perma-profit. To that end, I am not providing my analysis with any form of colored glasses or bias. I am simply explaining to you what I objectively see. And, when you sit back and attempt to understand what I am trying to convey, it should be quite sobering.
Again, I have never been one who is going to continually warn you of an imminent bear market, as many other authors or analysts seem to do for their various reasons. You all know those of which I speak. And, just as a broken clock, they will eventually be right. Rather, I am one who is only interested in being on the correct side of the market trend, with no bias for direction other than what the market presents to me.
Now, when I say I am unable to ascertain whether the impending long-term bear market will last 5-8 years or as long as 20 years, it is simply because I will need to see the nature of the rally developing once we complete the 5-8 year initial segment of the bear market. If the rally thereafter is clearly corrective, then it will be clear that this long-term bear market will take us at least 13 years and as long as 21 years.
I want to also quote something else I said from the articles above:
Lastly, I want to note that I am generally a very positive individual. In fact, those that know my own personal story know that the only way I am where I am today, and not lying in some gutter somewhere having given up on life, is due to my positive attitude. So, it does pain me to write such an article. Therefore, please recognize the context within which I am presenting this article, as it is certainly not coming from the pen of a perma-bear or one who is always negative, so please take it with the seriousness with which it is meant.
Again, much of what I am saying is going to strike a nerve in those like the commenter above. And there are many others that maintain the same perspective. But, consider what has occurred in Japan and how long their bear market lasted. The Nikkei topped at the end of 1989 and did not bottom until 2009. That is a 20-year bear market, my friends.
If we were to really delve into history (well beyond the commenter's 42 years of experience), we would also recognize that there was a bear market in Europe between 1768-1784. That is a 16-year bear market for those counting. And, if you look at our 100+ year chart, you will see that there was potentially also a 30-year bear market in the early 1800s.
Now, after an almost 90-year bull market run from the early 1930s until the early 2020s, wherein the largest corrections lasted no more than 10 years, can you really discount the potential for a multi-decade bear market in the United States? There is certainly historical support for it if you understand market history beyond our modern history. Yet, most people view the market through a recency bias.
Well, based on history and the analysis legacy left to us by Ralph Nelson Elliott, I think it is a strong probability that we will see a long-term bear market in the United States. But, again, I am one who seeks proof and will never be a perma-anything. So, I will continue to listen to the messages provided to us by Mr. Market. The year 2023 will likely tell us if we have one more rally yet to come before the long-term bear market begins in earnest or if we have indeed begun it already.
And, for heaven's sake, please do not approach the market with a linear perspective. Financial markets are not linear environments. Approaching them with a linear perspective will only worsen the impending long-term bear market's pain. You have a responsibility to your family to make sure you prepare appropriately rather than sticking your head in the sand and believing that it simply cannot happen because you have not seen it in the United States in your lifetime.
Trading in financial instruments and/or cryptocurrencies involves high risks including the risk of losing some, or all, of your investment amount, and may not be suitable for all investors. Prices of cryptocurrencies are extremely volatile and may be affected by external factors such as financial, regulatory or political events. Trading on margin increases the financial risks.
Before deciding to trade in financial instrument or cryptocurrencies you should be fully informed of the risks and costs associated with trading the financial markets, carefully consider your investment objectives, level of experience, and risk appetite, and seek professional advice where needed.
Fusion Media would like to remind you that the data contained in this website is not necessarily real-time nor accurate. The data and prices on the website are not necessarily provided by any market or exchange, but may be provided by market makers, and so prices may not be accurate and may differ from the actual price at any given market, meaning prices are indicative and not appropriate for trading purposes. Fusion Media and any provider of the data contained in this website will not accept liability for any loss or damage as a result of your trading, or your reliance on the information contained within this website.
It is prohibited to use, store, reproduce, display, modify, transmit or distribute the data contained in this website without the explicit prior written permission of Fusion Media and/or the data provider. All intellectual property rights are reserved by the providers and/or the exchange providing the data contained in this website.
Fusion Media may be compensated by the advertisers that appear on the website, based on your interaction with the advertisements or advertisers.