
Trading conditions in the crude oil futures arena at NYMEX have been like riding a psychotic horse through a burning barn in 2020. The year started with a military confrontation between the U.S. and Iran in Iraq. It sent the price of the energy commodity to a high of $65.65 per barrel in early January. By April 20, the price of nearby futures fell below zero for the first time in history.
A perfect bearish storm created by evaporation of demand and a flood of supplies created a gap on the chart in early March. The oil price became a falling knife, reversed and worked its way into the void on the chart. The recovery that began in late April filled most, but not all, of a gap on the August futures contract.
As the world continues to face the global pandemic, the demand for energy remains far below its level last year. Meanwhile, significant production cuts have gone a long way towards balancing the supply and demand equation. The piece of the gap on August futures continues to stick out like a sore thumb on the futures chart and could act as a magnet for the price over the coming weeks. United States Oil Fund (NYSE:USO) tracks the price of NYMEX futures higher and lower.
54 Cents To Go On The Upside: Open Interest Drops To Lowest Level Of Year
On June 23, the price of August NYMEX crude oil futures traded to a high of $41.63 per barrel, where they ran out of upside steam.
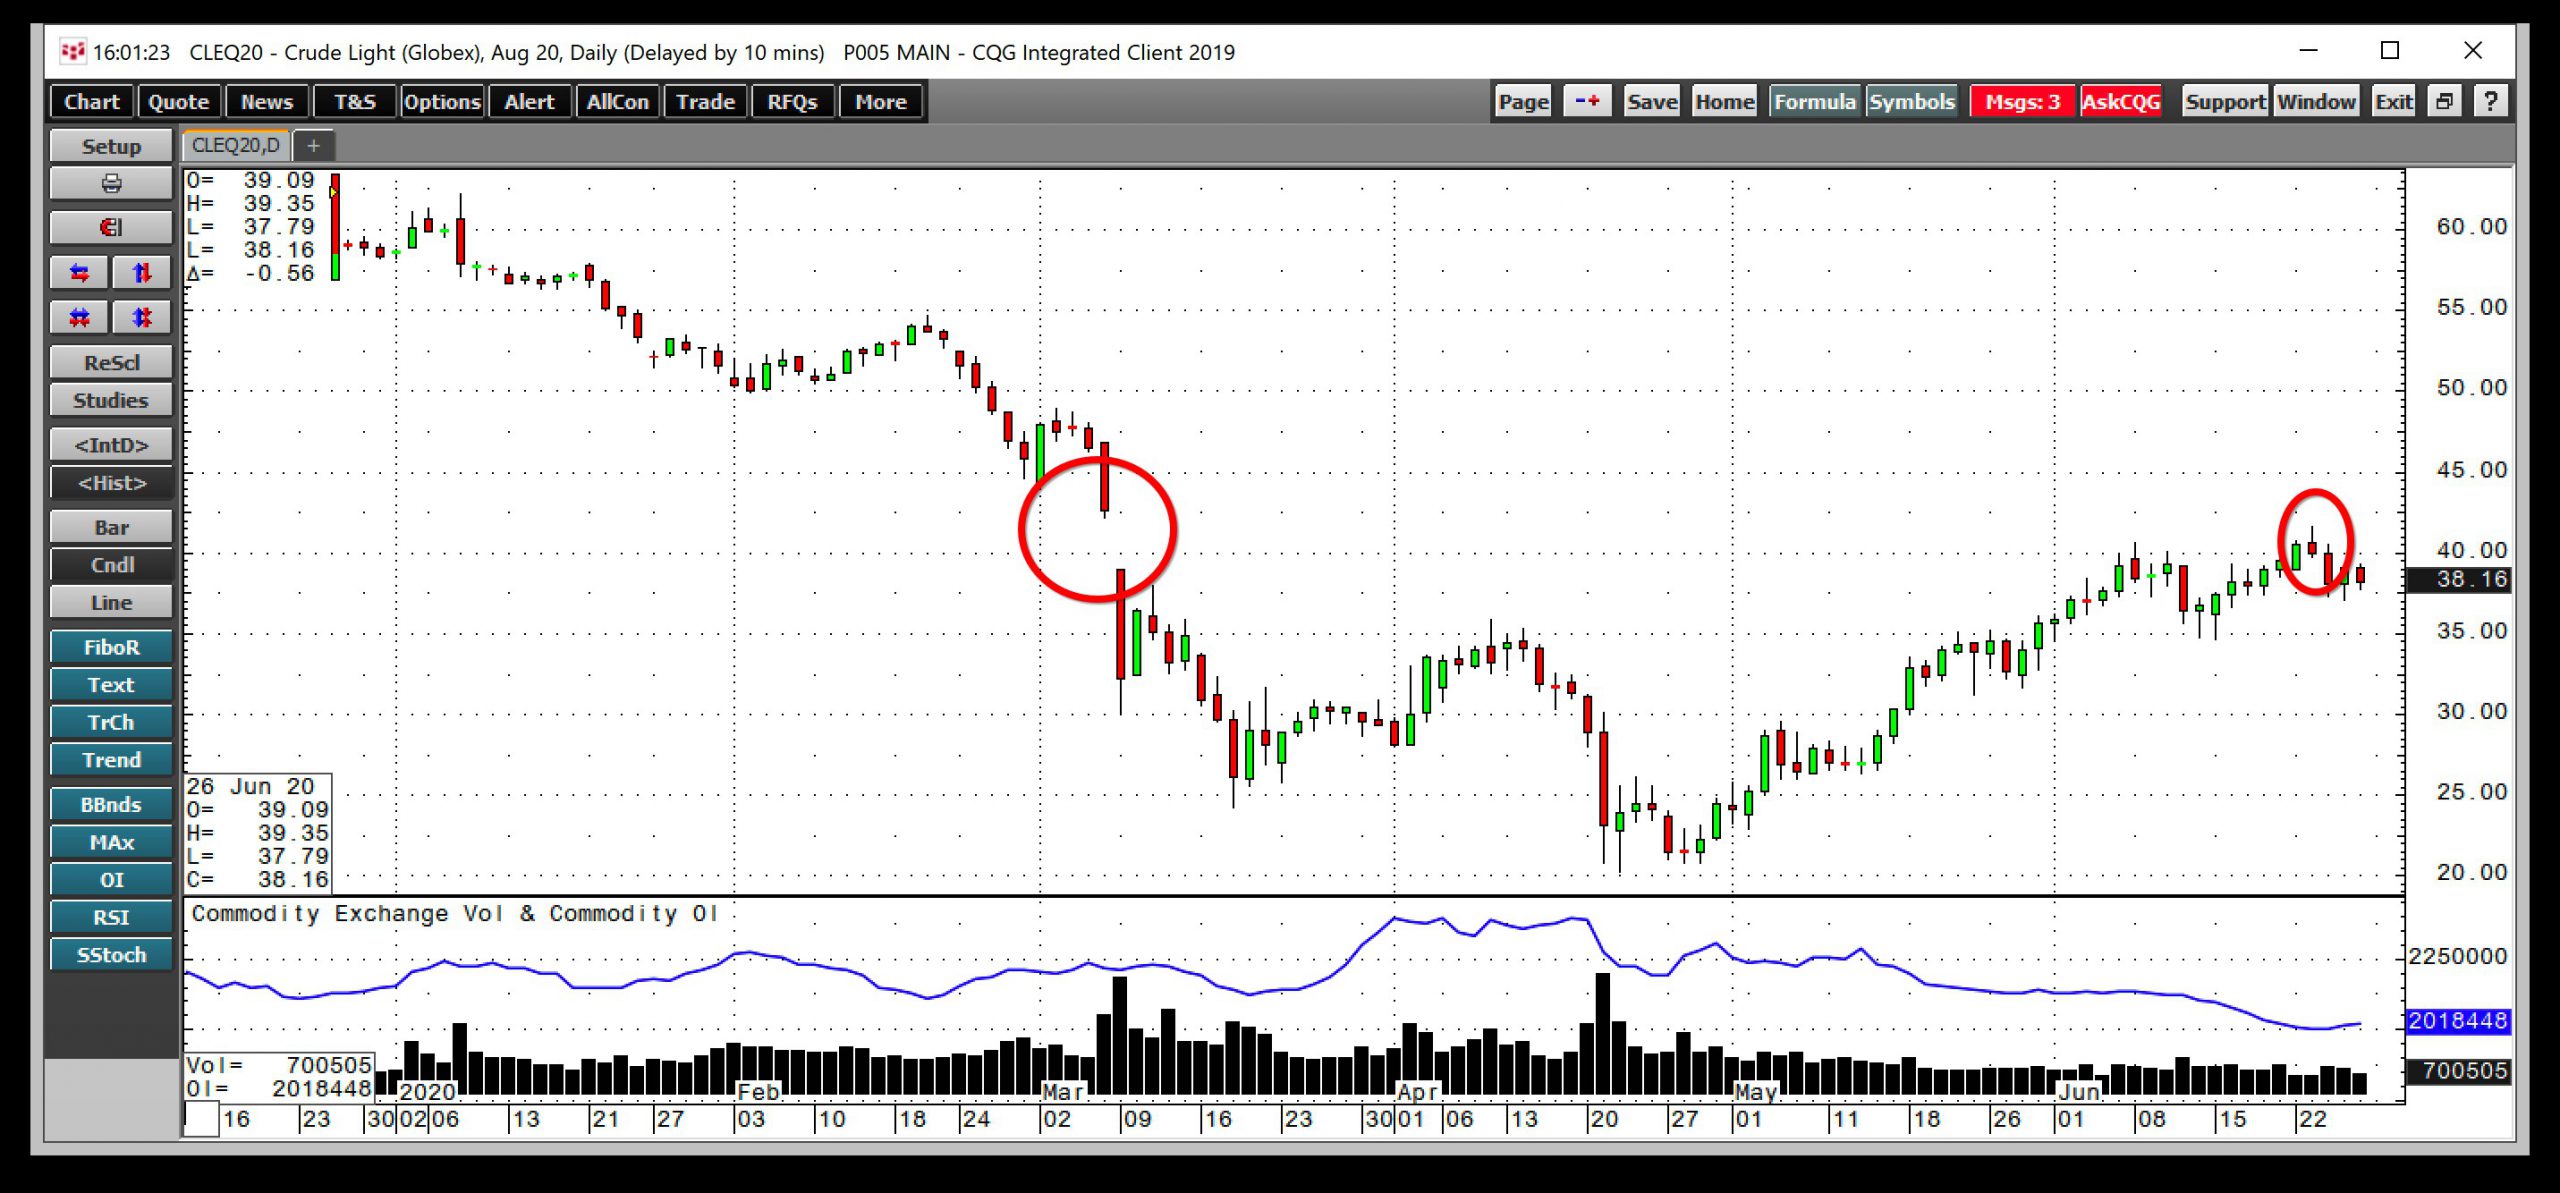
Source: CQG
As the daily chart highlights, the price stopped 54 cents short of filling the gap from March 6-9 that created a void between $38.98 and $42.17 per barrel. Crude oil took an elevator shaft to the downside in March and April but had been taking the stairs higher since late April when the nearby futures contract ventured into negative territory for the first time.
The total number of open long and short positions in the NYMEX crude oil market stood at 2.018 million contracts at the end of last week. The open interest metric was marginally above the most recent low of 2,000,075 contracts on June 24, not only the low for 2020 but the lowest level in over one year.
Success On Weekly Chart
Crude oil had more success with the void on the chart on the weekly chart.
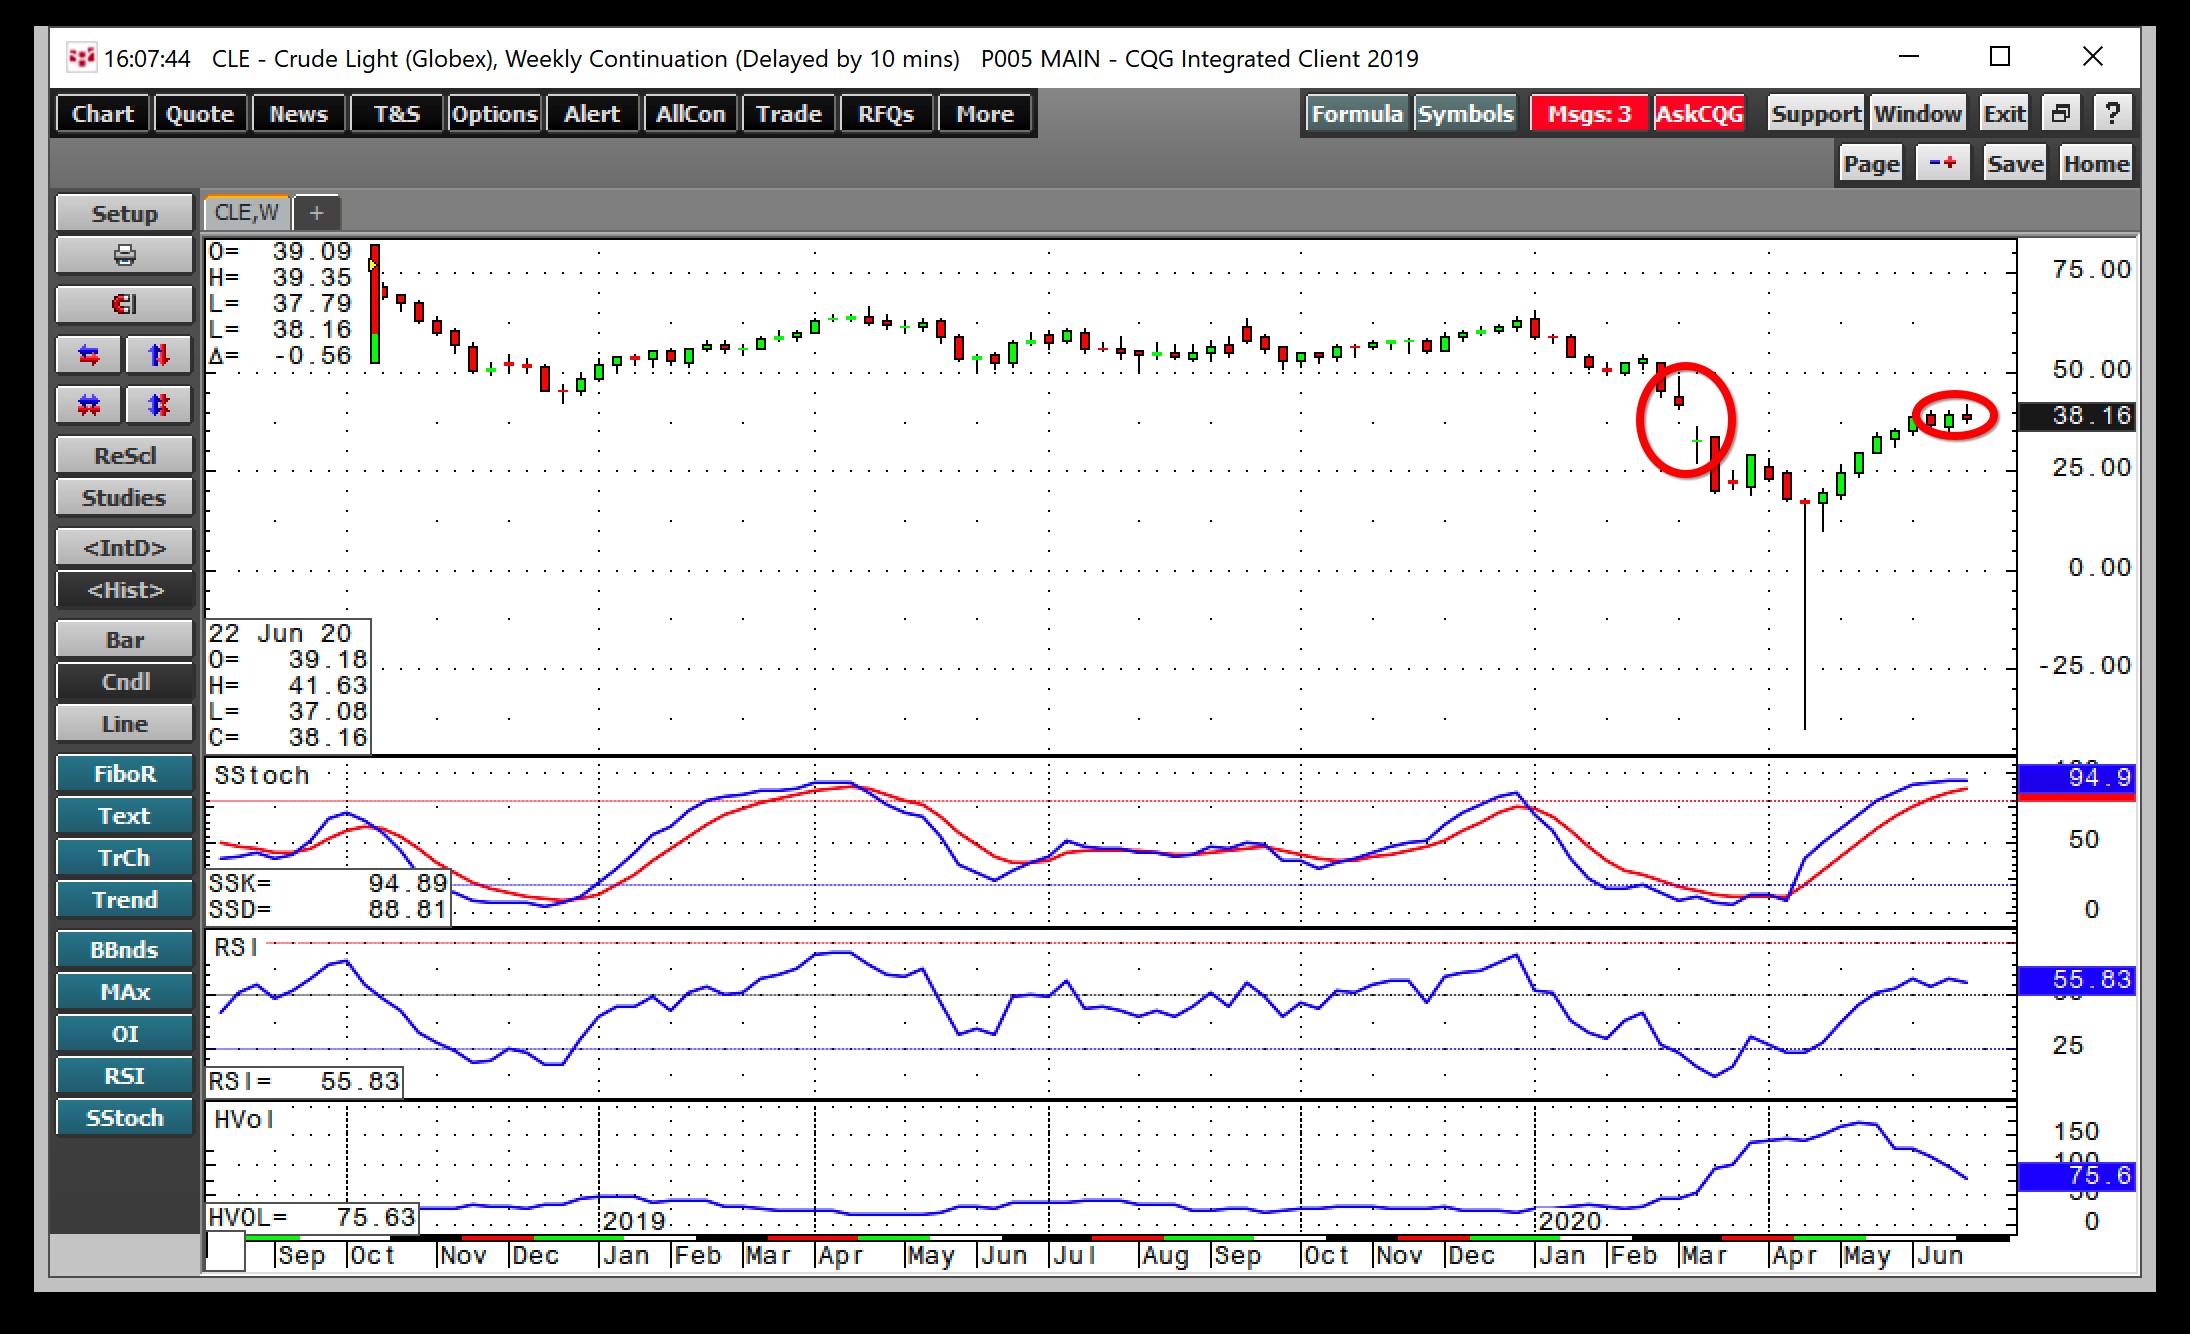
Source: CQG
As the weekly chart illustrates, the gap from March was from $36.35 to $41.05. The high from last week at $41.63 finally erased the void on the chart.
From a weekly perspective, the recovery in crude oil from negative territory to over $41 per barrel pushed price momentum into an overbought condition. Relative strength at almost the 56 level was just above neutral territory at the end of last week. Meanwhile, tighter weekly trading ranges sent weekly historical volatility from a high of over 172% in May to 75.6% at the end of last week. With crude oil at just over the $38 per barrel level on June 26, production is declining, but fears over the coronavirus continue to weigh on demand for the energy commodity.
Falling Production And Stimulus: More Surprises Ahead
Last week’s data from the American Petroleum Institute and the Energy Information Administration provided conflicting signals for the crude oil futures market. The API said that oil inventories rose by 1.749 million barrels for the week ending on June 19. The EIA reported a 1.4-million-barrel increase in stockpiles for the same period. Both told the market that oil product stocks moved mostly lower. However, the EIA reported a rise in U.S. daily output of 500,000 barrels to 11 million. Meanwhile, production is still around 2.1 mbpd lower than the peak in March when it rose to 13.1 mbpd.
Baker Hughes said that the number of oil rigs operating in the U.S. as of June 26 was 188 – 605 rigs lower than at the end of June in 2019.
At the same time, a weaker U.S. dollar over the past weeks and unprecedented levels of stimulus from the U.S. Fed continues to provide some underlying support for the price of crude oil. The last time the market received anywhere near the current level of monetary policy accommodation from the central bank was following the 2008 financial crisis in the U.S. In 2008, the price of nearby NYMEX crude oil futures fell to a low of $32.48 per barrel, by 2011, the price was back above the $100 level.
The gap on the August chart could still act as a magnet for the price of crude oil. The Middle East, which is home to more than half the world’s oil reserves, remains the most turbulent political region on the face of the earth. Volatility may have moved significantly lower in the crude oil futures arena over the past weeks, but wild price swings could return in the blink of an eye. Crude oil will be watching the stock market, which is reacting to the ongoing COVID-19 problem. I expect wide price swings to continue in the world’s leading energy commodity for the rest of 2020.