- Most US stocks rose on Friday but finished the week lower
- Yields set to top out, suggesting more equity selloffs; VIX rose as well
- Dollar fell from 17-month high to bottom of rising channel
- WTI on course for Death Cross
Renewed hopes of a resolution to the ongoing trade dispute pushed major US benchmarks—the S&P 500, Dow and Russell 2000—higher for a second day on Friday. However, the NASDAQ Composite slipped yet again. All US averages ended the week lower as well, as the retail picture soured and technology shares languished. Treasury yields dropped, dragging down the dollar, signaling the possibility of risk-off sentiment returning to markets.
This is the opposite pattern seen in the previous two weeks, when stocks gained for the week but finished lower on Friday. We posited then that perhaps traders were losing their nerve and were unwilling to commit to weekend positions, yet were unable to forego investing when both the economy and earnings have been on fire. According to Gallup’s economic survey, this is the best economy in 19 years; reports also indicate we're seeing the highest consumer confidence in 14 years. As well, equity markets are just finishing their best earnings season since the financial crisis.
3 Reasons For Risk-Off's Return
So why is risk-off sentiment returning? A number of reasons:
Apple (NASDAQ:AAPL), which accounts for 12% of the NASDAQ's weighting and 5% of the Dow Jones Industrial Average, had its worst week in seven months last week, down 5%, 16% off its recent high. Concerns about disappointing iPhone sales and slower growth led shares to their seventh straight weekly loss, the longest negative stretch for the stock since 2012.
Crude oil volatility also continued. While higher gasoline prices boosted inflation in October, the recent slump in prices will have the opposite effect. Overall, however, consumer prices rose as much as expected last month, easing fears of overheating inflation and faster interest rate hikes.
On the Brexit front, a draft deal for the withdrawal of Britain from the European Union was reached, but that plan needs to survive vetting in Parliament and cabinet defections are pointing to continued uncertainty for a final deal.
Mega Caps Back On Top
In a rare occurrence, last seen in March, on Friday, both small caps and mega caps outperformed. Since the trade war broke out, the two indices have had a negative correlation, as traders rotated to domestic companies when trade risk increased, since growth for those companies was not reliant on exports; then rotated back to mega caps when headlines spurred hopes for a trade deal. Technically, however, they are on the opposite ends of the spectrum, with the Dow providing the strongest picture and the Russell the weakest.
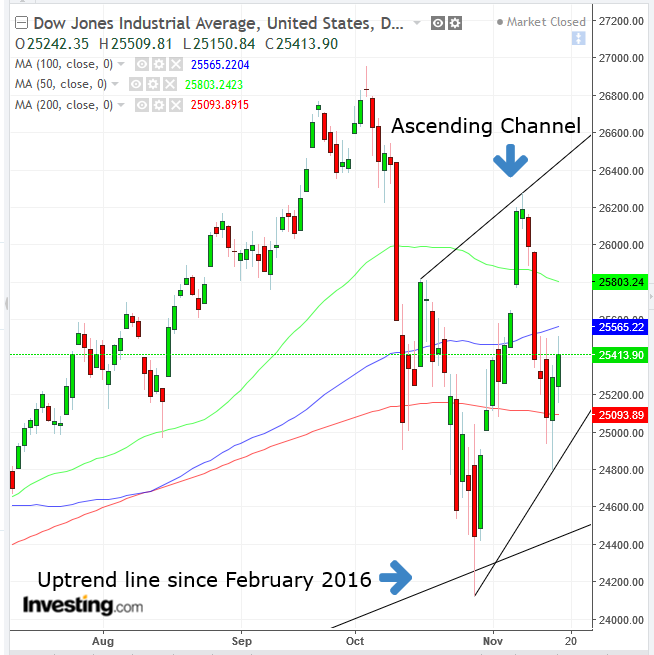
The Dow Jones Industrial Average rose 0.49 percent on Friday, for a second day, gaining a total of 1.33 percent. The 30-component index jumped after US President Donald Trump appeared to signal a willingness to come to a deal with China at this month’s G-20 summit.
Energy firms Chevron (NYSE:CVX) and ExxonMobil (NYSE:XOM) which together have over a 5 percent weighting of the average, tracked crude's rally, for a third day. Technically, the Dow outperformed among the major US indices.
It remains above its uptrend line since the previous, early 2016 correction, as well as above its 200 DMA; with MAs in a bullish pattern (shorter MAs above longer MAs, demonstrating that performance improves with time), and, finally, the mega cap index is the only one trending upward in the mid-term, as it trades within an ascending channel.
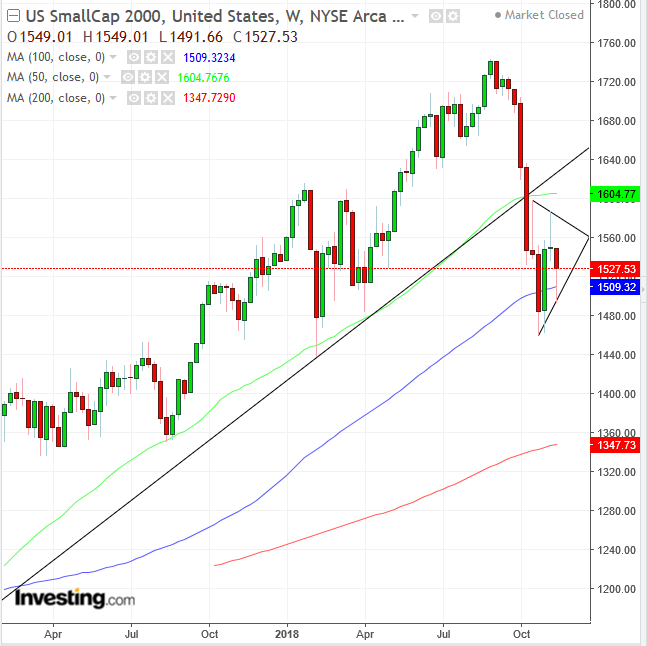
The Russell 2000 climbed 0.51 percent on Friday, for the second day to a combined gain of 1.67 percent. It outperformed among the major US indices both on Friday and over the course of the two-day rally.
Still, it's showing the weakest technical picture, in a mirror image of the Dow, despite the ongoing trade war. The Russell is almost 6 percent below its uptrend line since the February 2016 bottom, as well as the 200 DMA. The 50 DMA just crossed below the 200 DMA, executing a death cross, an ominous sign that prices are heading in the wrong direction, a signal that's watched not just by technically oriented traders.
Finally, the supply-demand equation has been forming a symmetrical triangle, bearish after the 165 point decline since September. Its bearishness is confirmed by its formation below the long-term uptrend line, compounded by developing below the 200 DMA, which just executed a Death Cross, no less.
The S&P 500 Index climbed 0.22 percent for the second day, for a total 1.28 percent gain. The index surged Friday after President Trump appeared to signal a willingness to finally reach a trade deal with China. But those gains were tempered by flagging consumer and retail shares.
Department store chain Nordstrom (NYSE:JWN) slumped on disappointing results, following earnings misses earlier in the week from Macy’s (NYSE:M) and Dillard’s (NYSE:DDS). Technology stocks wavered after chipmaker Nvidia (NASDAQ:NVDA) released its less than stellar earnings report and forward guidance at the end of the day, further pressuring the Tech sector.
Utilities outperformed (+1.54 percent), followed by Energy (+1.19 percent). Technically, the SPX is below both its long-term uptrend line and its 200 DMA. As well, the 50 DMA just crossed below its 100 DMA.
The only US index to finish the week in the red, the NASDAQ fell 0.15 percent, dragged lower by Nvidia which had its worst trading day in a decade. Nevertheless, it's still higher on a Thursday-Friday basis than all indices but the Dow, up 1.56 percent. Technically, while it remains above its uptrend line since the bottom of the previous, January 2016 correction, it is also still above its 200 DMA. However, its 50 DMA just crossed below its 100 DMA. Finally, trade formed a symmetrical triangle, bearish after the October 1-29, 14.6 percent plunge.
For all the negative headlines, adverse pundit opinions and softer guidance by company executives, the Dow is still up 2.81 percent year-to-date, second only to the NASDAQ’s 5.9 percent gains for the same period; however the Russell has underperformed during that timeframe, for a loss of 0.5 percent. Thus, while the debate over the longevity of the current bull market may resume as China’s growth slows and the Fed continues raising interest rates, the trade war is empirically not one of the market’s headwinds.
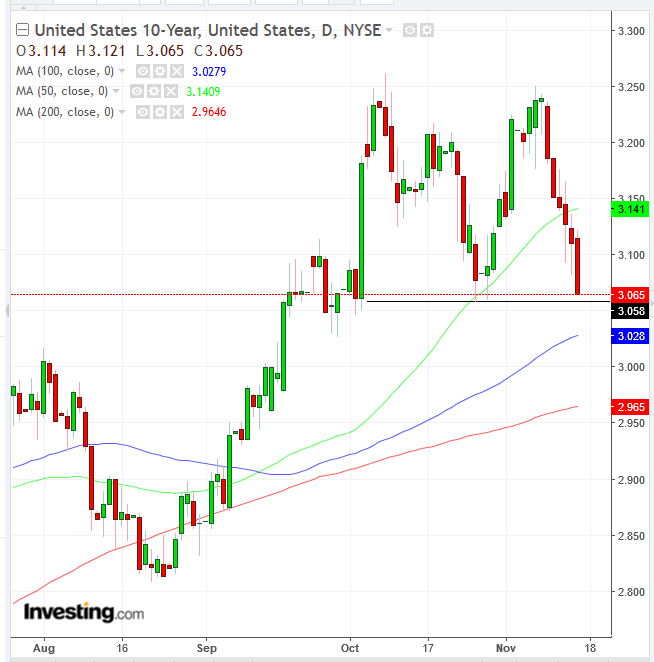
Some of the pressure on the dollar and bond yields followed remarks by Federal Reserve Vice Chairman Richard Clarida, who said on Friday that policy is getting close to neutral and there is some evidence of global slowing.
Last Monday, when the 10-year yield reached 3.186, we alerted of the potential for a double-top reversal. Currently at 3.065, after having closed at the very lowest point of the session, the rate is about to provide a downside breakout, with a target of 2.87 percent.
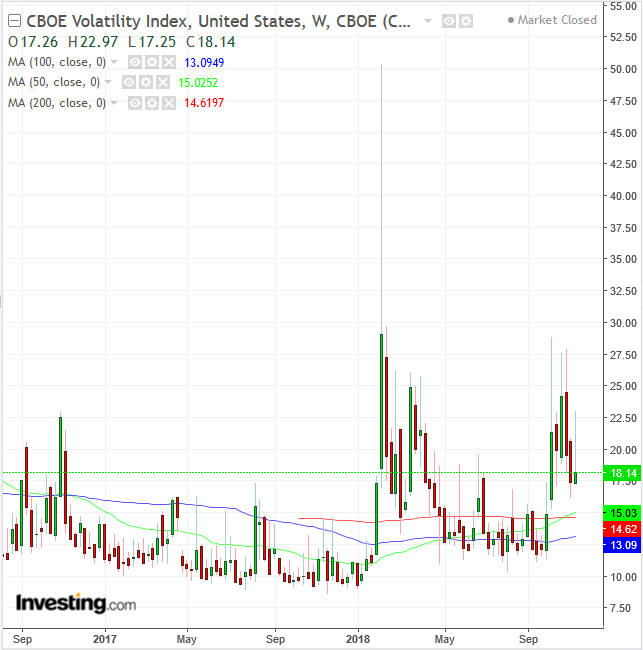
While investor bets on volatility dropped on Thursday and Friday, overall they rose for the week, for the first time after two weeks during which the VIX fell, in a mirror image of equities. The index is still above levels seen during all of 2017 and April through October of 2018.
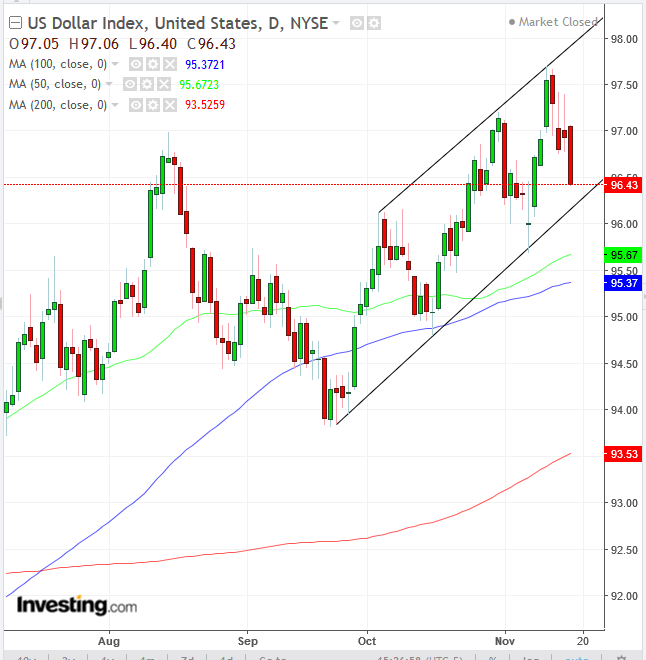
After its highest close in almost 17 months, the dollar's correction is taking back all of its gains, bringing the global reserve currency to the bottom of an ascending channel, which is above both the 50 and 100 DMAs, providing an attractive risk-reward ratio for a short-to-mid-term long position. However, should yields complete a double top, the lower return would attract fewer foreign investors, reducing demand for the greenback, in which case it could fall below the rising channel.
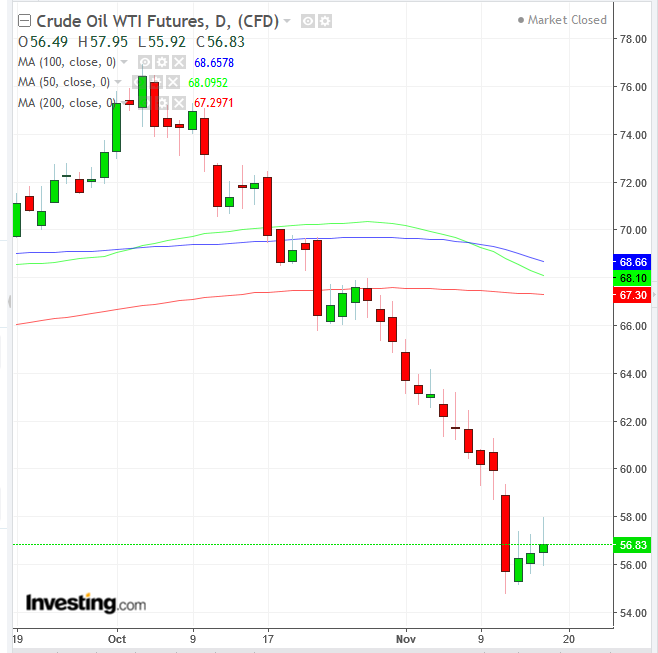
After 12 straight days of losses, oil's longest losing streak on record, the commodity bounced, gaining 2 percent over the last three days. Still, it closed well off its Friday high, demonstrating just how much pressure there is on the price.
It's noteworthy that the dollar has fallen in three of the previous four days, to the tune of 1.15 percent, making oil cheaper. Technically, the 50 DMA fell below the 100 DA and is set to cross below the 200 DMA for a Death Cross.
Week Ahead
All times listed are EST
Monday
19:30: Australia – RBA Meeting Minutes: Earlier in the month the Reserve Bank of Australia stayed the course, sticking to its record low interest rate, even after the country's economic and inflation outlook were upgraded. As a result the jobless rate fell to a decade-low of 5 percent.
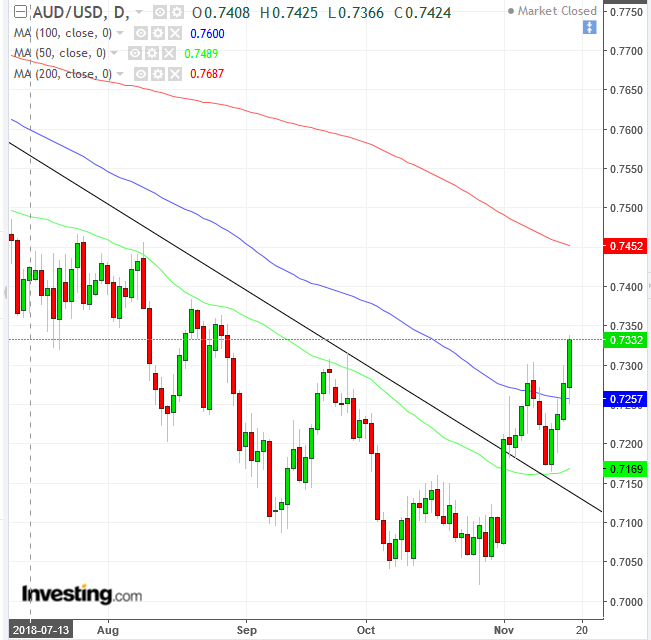
Surging Australian employment helped the AUD/USD enter an uptrend after the dollar weakened on improving risk sentiment, allowing the pair to cross over its downtrend line.
Tuesday
8:30: US – Housing Starts and Building Permits (October): permits to hit 1.260 million and starts to increase to 1.225 million
Wednesday
8:30: US – Durable Goods Orders (October): orders to fall 2.5% MoM and Core Durable Goods Orders to rise 0.4% from 0.1% MoM.
10:00: US – University of Michigan Consumer Sentiment (November): index forecast to remain steady at 98.3.
10:30: US – EIA Crude Oil Inventories (w/e 16 November): stockpiles to rise for the ninth straight week by 3.182 million barrels.
Thursday
10:00: Eurozone – Consumer Confidence (November, flash): index to drop to -3.0 from -2.7.
Friday
3:15 – 4:00: France, Germany, Eurozone – Manufacturing and Services PMIs (November, flash): these are expected broadly to improve over the past month, although any weakness in the German figures may hit the euro.
8:30: Canada – CPI (October): inflation forecast to remain steady at 2.2% YoY
9:45: US – Manufacturing and Services PMI (November, flash): manufacturing PMI to stay flat at 55.7, while services PMI to edge up to 54.9 from 54.8.
