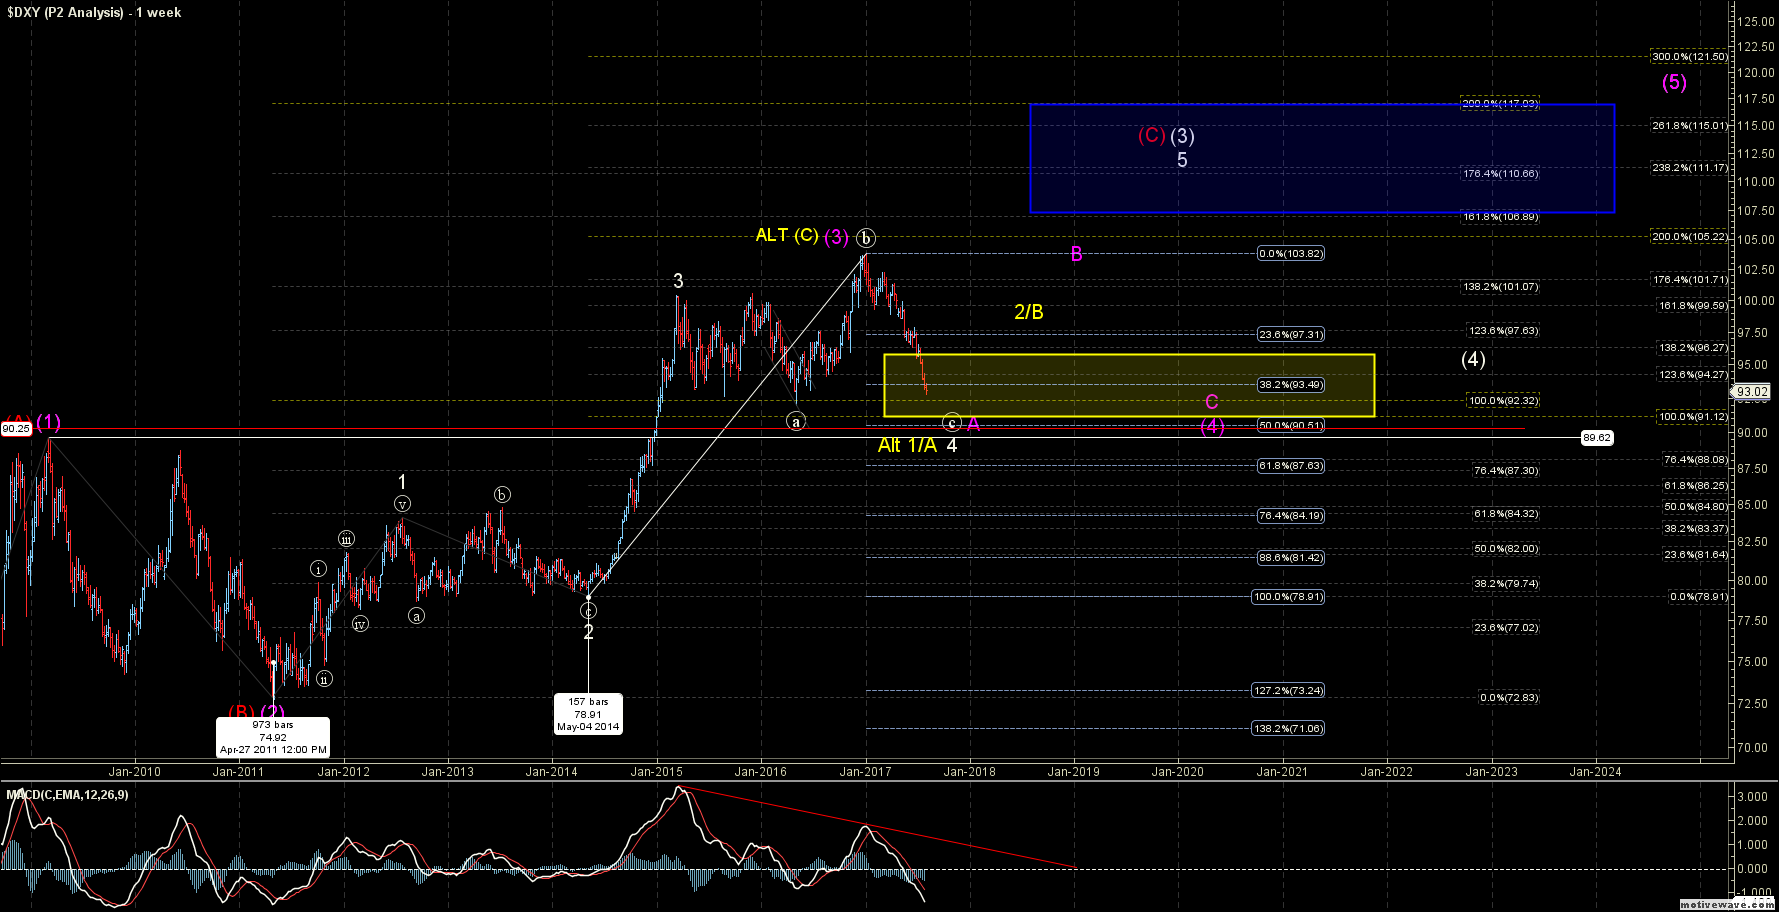
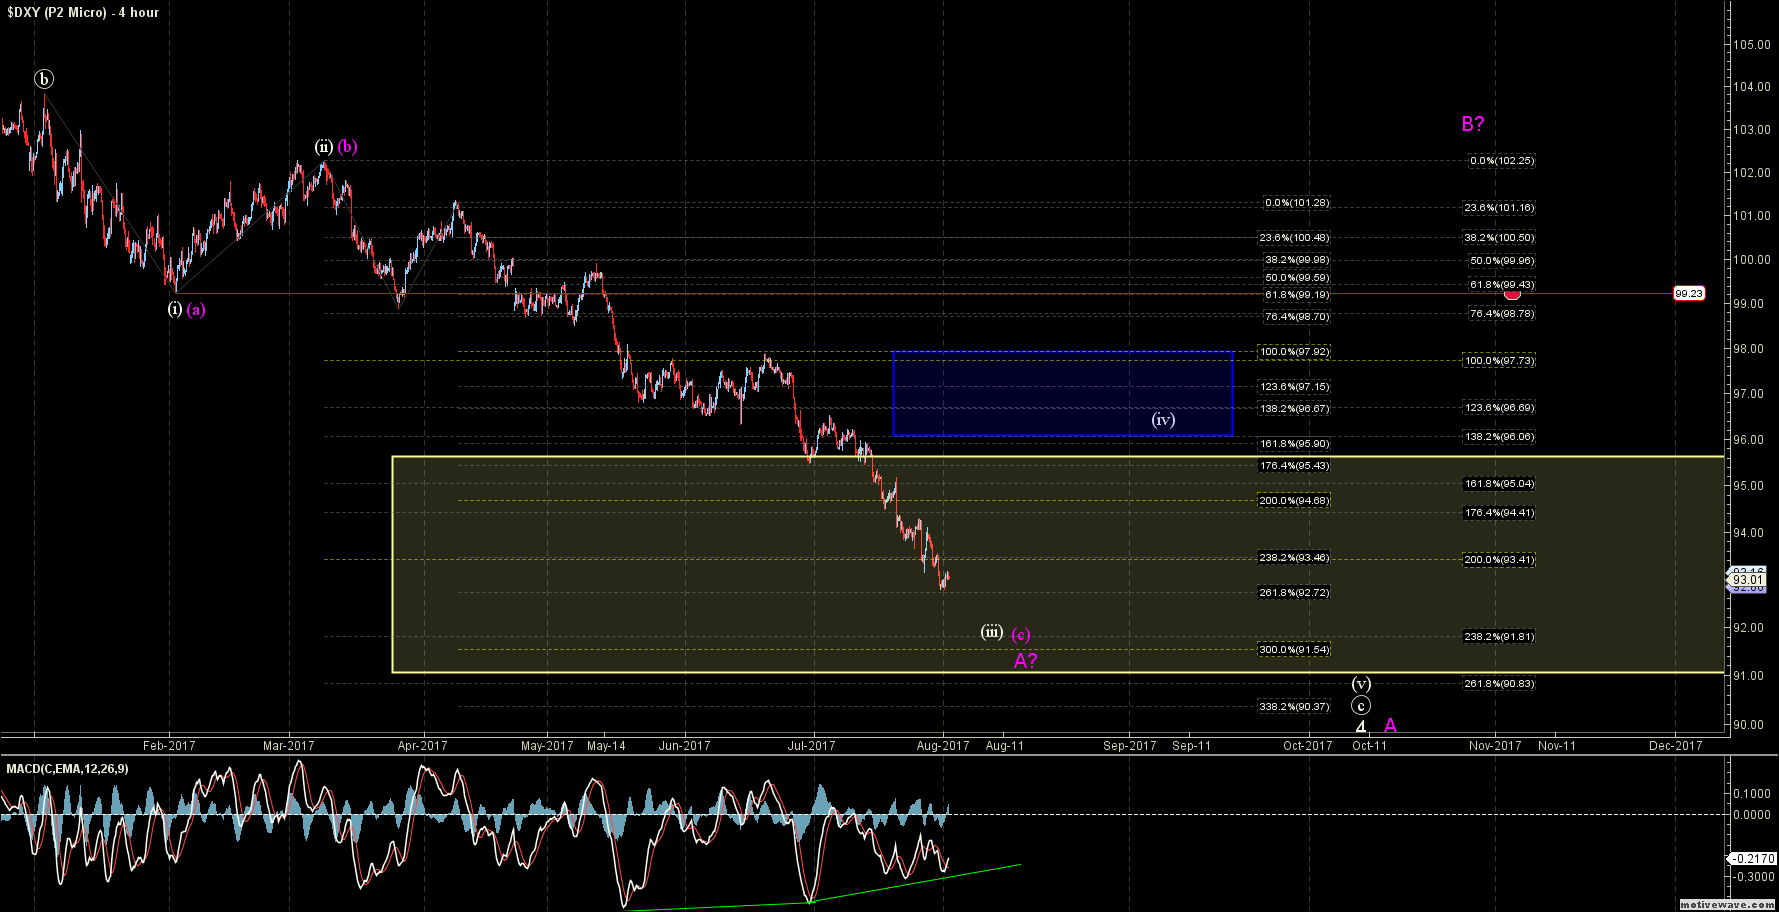
The U.S. dollar has continued to fall hitting a low of 92.72 on Monday, July 31st. The U.S. dollar also broke through shorter term support levels and is now closing in on long-term support that could very well define the longer term trend over the next several years.

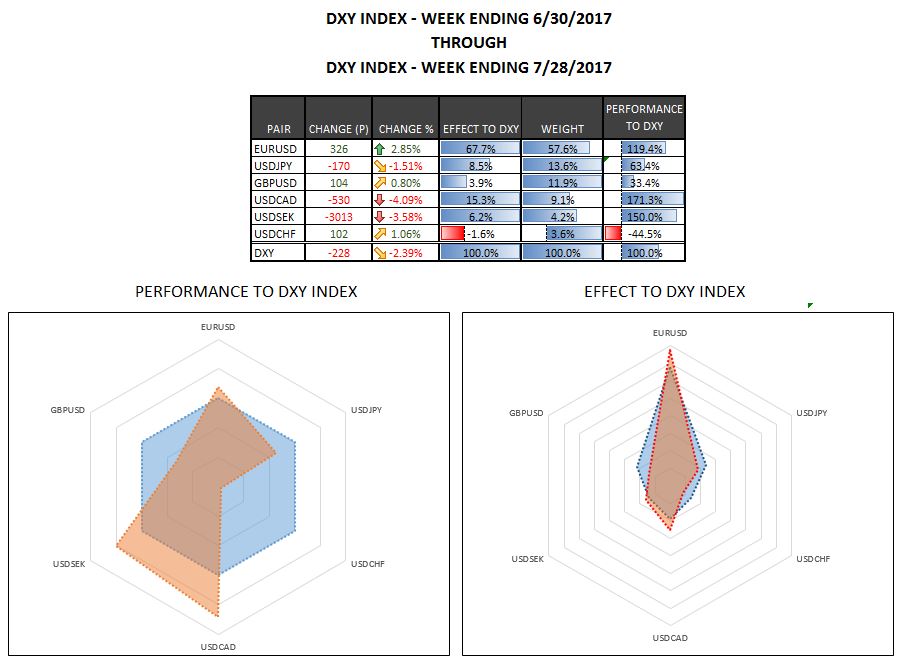
When most financial writers (to which I include myself) refer to the U.S. dollar they are typically referencing the DXY index. The DXY index is composed of 6 currency pairs that are based mostly in Europe. The euro vs. the U.S. dollar makes up 58% of the DXY index with the British pound, Swedish krona and Swiss franc making up an additional 19.7% of the index combined.
What this means is that the DXY Index, which is widely cited as the “U.S. Dollar”, is really a basket of currencies as measured against the U.S. Dollar. 77% of this DXY Index are European currency pairs. The U.S. dollar vs. the Canadian dollar and the U.S. dollar vs. the Japanese yen make up the remaining 23% of the index. This leaves a vast number of countries not represented at all within the DXY Index.

It is still useful to track the DXY as it remains a widely used barometer of the strength of the U.S. dollar. The lack of diversity within the index does at times lead to divergences of currency pairs that are inside and outside of the Index. We can often use how much divergence is being seen in the DXY index to help gauge the overall strength of the trend.
The month of July saw some increased divergence with the component pairs of the DXY Index. This was in comparison to the relative lack of divergence that was seen from the January top into the August lows.

The U.S. Dollar rose close to 1.6% against the Swiss franc in July while the Index as whole moved down 2.39%. The pound and the yen also underperformed the DXY Index but did still move in higher against the U.S. dollar in July. The Canadian dollar and the Swedish krona outperformed the DXY Index with the U.S. dollar vs. the Canadian dollar dropping over 4% in July.
The price levels of the index do take precedence over all other indicators, and divergences can still be useful. Currently, the increase in divergence does fit with the expectation that we should be close to either a corrective bounce or consolidation on the DXY. If and when this bounce/consolidation does occur I would expect the divergences in the component pairs of the DXY to continue to increase.
As noted above, this week the DXY index broke through the shorter term support levels that I was watching last week. Those support levels had come in at the 93.50/40 levels. These levels represented two shorter term Fibonacci price targets.
With this continued extension lower I now look towards the extended Fibonacci price target levels. As of this writing, the DXY has held the 92.72 level which represents the 261.8 extension of the move down off of the March highs. Should we see a break of this level, there really is not much in the way of shorter term Fibonacci support until the 91.81-91.54 zone.
These shorter term support levels are also very close to the lower end of the long-term support zone which comes in at the 91.12 level. A strong break of this 91.12 level would be the initial signal that this larger degree bullish pattern is breaking down. This would then open the door to the DXY seeing much lower levels over the course of the next several years.
For now, as long as the DXY continues to hold the 92.12 level on the larger degree time frame I still prefer to see this move higher at least for a corrective bounce. With that said and as noted last week until this can get over the short term resistance level of 96.06-97.92 the DXY still likely has more work to do to the downside prior to revisiting those January highs.
