- U.S. contracts sink after yesterday's Wall Street leap
- Oil setting up for another selloff
Key Events
Yet another instance of congestion seems to be gripping markets this morning as U.S. futures for the S&P 500, Dow Jones and NASDAQ once again head lower, in tandem with Treasury yields. It's a repeat of what seems to have become the daily market seesaw wherein last night's gains are sold off the following morning.
Oil retreated after jumping higher in early Asian trade. The dollar has softened.
Global Financial Affairs
Contracts for the S&P 500 slipped over 1.5% in the wake of a vague announcement yesterday from President Donald Trump about upcoming payroll tax reductions, measures he said will offset the potential economic hit to U.S. workers and consumers from the coronavirus. However, the lack of details regarding the initiative was all-too-reminiscent of similar announcements earlier in his administration which were never actually launched or ultimately had little effect, such as the historic tax cut.
The Stoxx Europe 600 Index however, rebounded at the open, although all 19 industry sectors gave up their highs. Plus, at time of publication the pan-European index had reversed lower.
The earlier European advance could be attributed to Wednesday morning's emergency rate cut by the Bank of England, as opposed to the decline in U.S. futures, which might be explained by yesterday's strong U.S. equity bounce wherein major indices came roaring back by 5% after significant losses on Monday.
This morning, Asian stocks were red across the board, with regional indices wiping out all of Tuesday's gains. South Korea’s KOSPI fell to its lowest level since Feb. 17, 2016, but may still find support by the Aug. 6 intraday lows, potentially forming a double bottom at the very least. China’s Shanghai Composite (-0.94%) and Hong Kong’s Hang Seng (-0.63%) continued to 'outperform,' perhaps because local regulations appear to have slowed the Covid-19 spread.
We've pointed out before that Chinese equities have been providing the best relative performance notwithstanding the crisis, which originated there. So how is that possible? Likely a variety of reasons: after initially denying there was a problem, China's government has since proven to be an efficient public health crisis manager, enforcing local and even province-wide lockdowns as well as building a new hospital in a matter of days. Additionally, the country appears to have gotten past the panic phase and is calming down.
And even though the human cost has already been catastrophic, the number of local fatalities has slowed. Plus, it doesn't hurt that the PBoC has been pumping stimulus into the economy and is expected to keep the spigot open.
On Wall Street yesterday, U.S. stocks bounced back from their worst selloff since the 2008 crash, ending that long bull market. Perhaps there's a parallel to be made to the current situation, which investors should note, given we're still technically in the longest bull market on record, 11 years in the making.
The S&P 500 popped 4.9%; the NASDAQ Composite rose 4.95%.
Trading yesterday was not for the faint-of-heart, however. Equities ran amuck over the course of the day, erasing a gain of 3.5% to turn negative before a furious rally in the final two hours of trading, ultimately delivering the biggest daily gains since December 2018.

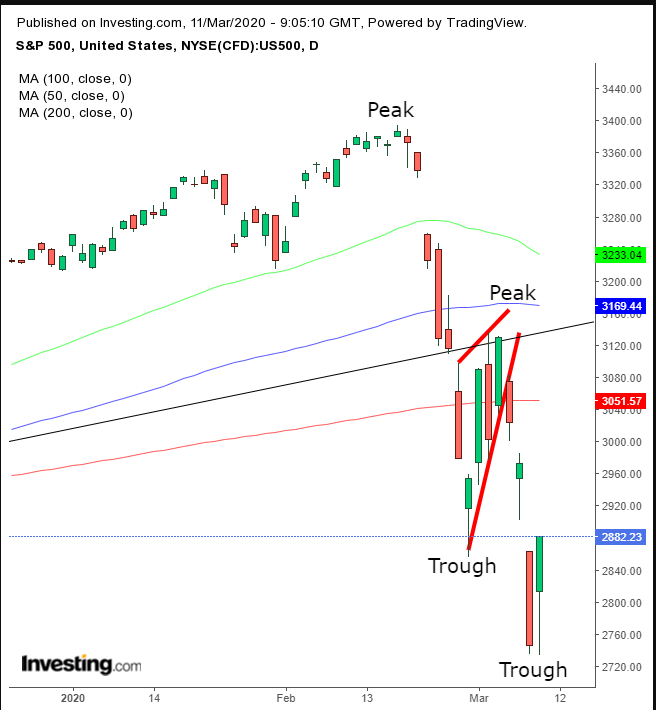
The SPX's current price behavior fits the trading pattern that generally follows the downside breakout of a continuation pattern. The market dynamics ripened for a return move to retest the rising flag before resuming its downward trajectory after forming a downtrend.
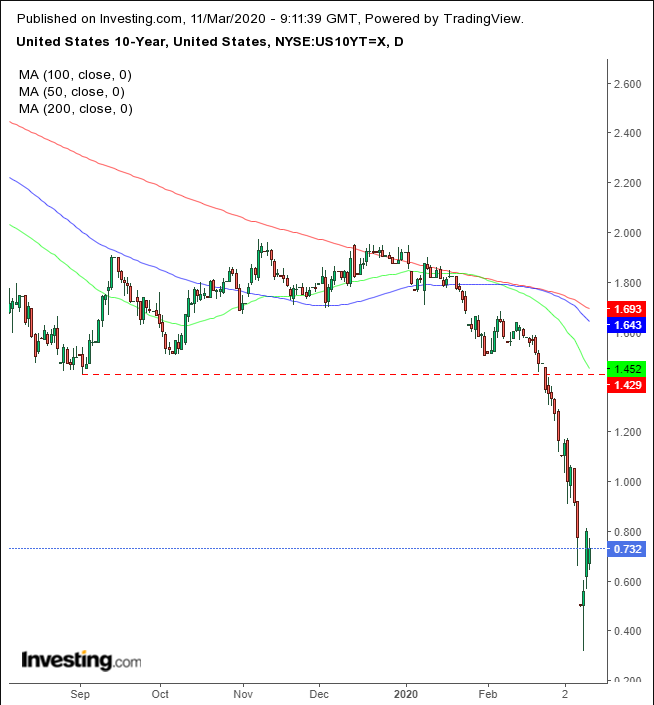
Yields, including for the benchmark 10-year Treasury note, ended a rebound from Monday’s 0.318 low, though some of that has been pared at time of writing, with the yield currently at 0.722.

From a technical perspective, yields have plenty of room for an upward correction toward the 1.45 resistance.

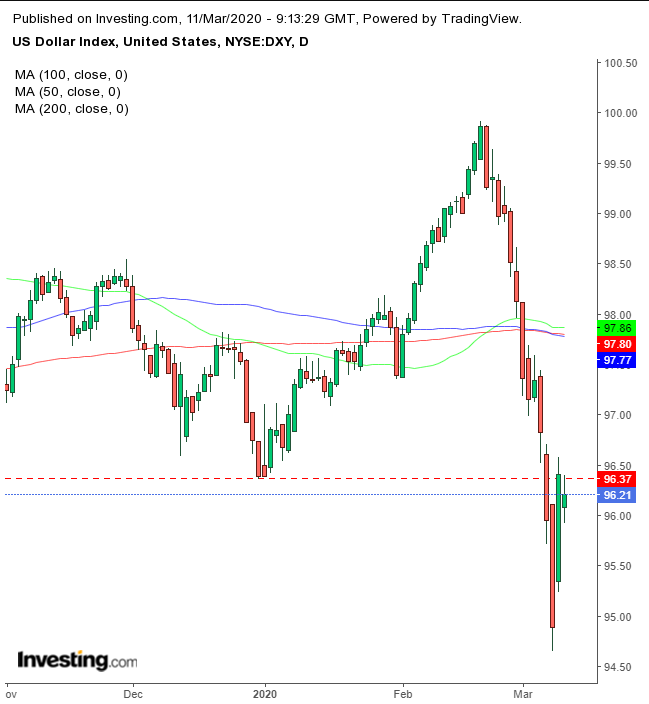
The U.S. Dollar Index retreated from yesterday’s massive rally, finding resistance by the Dec. 30 low.
Oil's advance slipped after Saudi Aramco (SE:2222) announced it will boost production yet further. The current Saudi-Russia price war could end up targeting U.S. shale drillers as well.

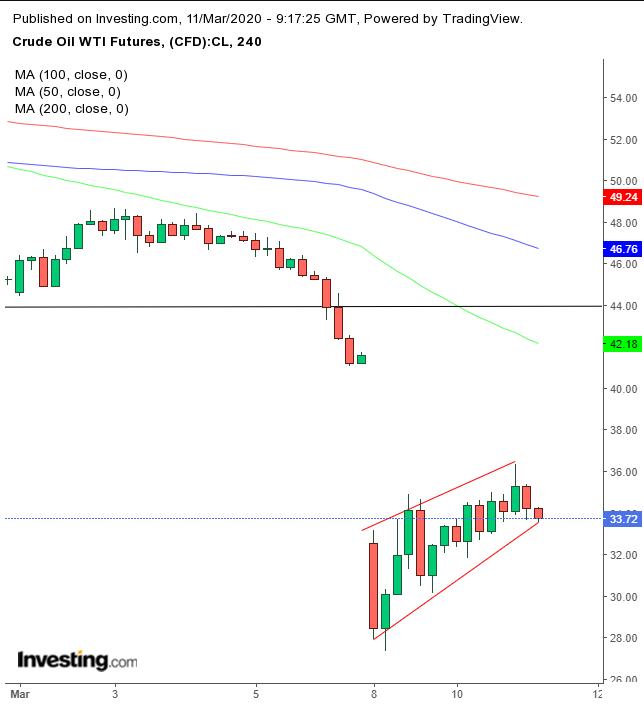
Technically, the price of oil is finding resistance by the breakaway falling gap, while forming a rising flag on the four-hour chart, bearish after the preceding plunge.
Up Ahead
- U.S. Core CPI is due Wednesday. It's anticipated to have remained flat in February.
- The European Central Bank’s policy decision comes out on Thursday; expectations are for it to ease.
Market Moves
Stocks
- The Stoxx Europe 600 Index gained 1.9%.
- Futures on the S&P 500 Index declined 1.9%.
- The MSCI All-Country World Equity Index was little changed.
- The UK’s FTSE 100 Index rose 1.9%.
Currencies
- The Dollar Index fell 0.2%.
- The euro rose 0.4% to $1.1323.
- The British pound increased 0.1% to $1.2929.
- The Japanese yen strengthened 0.6% to 104.98 per dollar.
Bonds
- The yield on 10-year Treasuries sank nine basis points to 0.71%.
- The yield on 2-year Treasuries fell nine basis points to 0.44%.
- Germany’s 10-year yield increased one basis point to -0.78%.
- Britain’s 10-year yield gained two basis points to 0.263%.
Commodities
- West Texas Intermediate crude dipped 0.6% to $34.16 a barrel.
- Gold strengthened 0.7% to $1,661.64 an ounce.
