There is an argument circulating that “the oil industry is set to thrive for decades to come," as technology dramatically reduces production costs. In addition, the two potential COVID-19 vaccines, from Pfizer and Moderna, with at least 90% efficacy in late stage trials, shine a light at the end of the lockdown tunnel.
However, right now, in the US coronavirus cases are still over one hundred thousand a day, and parts of the country are increasing social restrictions, which means—again—less demand for oil.
As a result, oil seems to have met with resistance, failing to extend yesterday’s rally, suggesting that there are more sellers than buyers despite all the recent good news on the vaccine front.

Oil has traded up and down and returned to its opening price, demonstrating indecision, as traders may feel at a loss regarding which headlines to trade: the out-of-control spread of coronavirus and increasing social restrictions or the two-pronged, potential vaccine progress by Pfizer (NYSE:PFE) and Moderna (NASDAQ:MRNA).
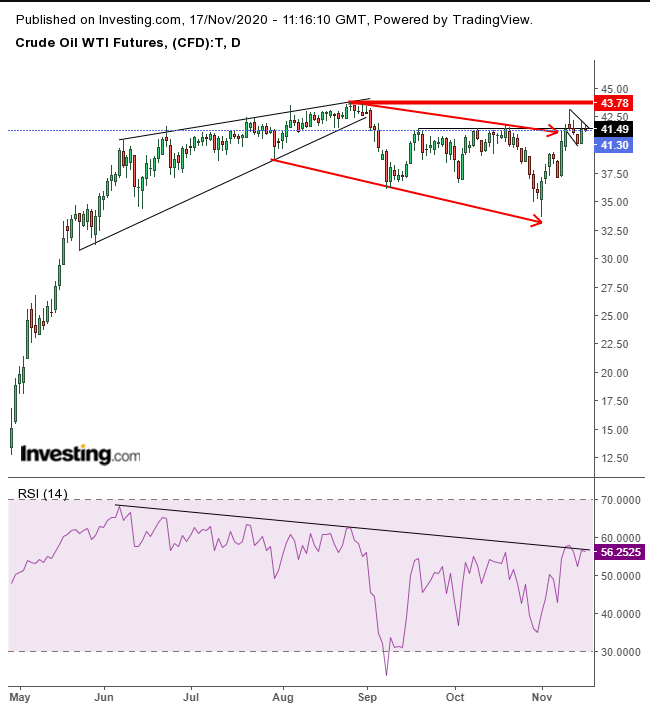
On Wednesday, the price developed a particularly ominous shooting star (extra-long upper shadow looming over bulls). The pattern’s presumed dynamics are that the intraday high lured bulls in, while the dramatically lower close forced them to unwind positions, reducing supply. The extended decline is seen to have attracted speculators to short the price, triggering a self-fulfilling prophecy.
Note that the price is struggling precisely at the September-October highs which is in the same area as the top of a falling channel would be. The RSI is retesting a long-time downtrend since the beginning of a rising wedge, in place since mid-May. The wedge had a bearish bias following the climactic move that preceded it.
The idea is that traders jumped in hoping for more of the same, but as the advance lost acceleration the disappointed bulls would sell out. That caused the downside breakout, confirming its bearish nature, and pointing at a downward trajectory. The RSI provided a heads up to observant traders when, since early June until the Sept. 1 downside breakout of the wedge, the indicator fell even as prices were rising prices.
A note of caution: while the preceding three-day selloff from Wednesday through Friday demonstrates that sellers are in control at these price levels, the bearish nature of the move is compounded by the price meeting the September-October highs, at the top of the falling channel, following a bearish wedge. This could be a setup for a falling flag, bullish after the preceding sharp, two day advance.
The RSI might also be setting up for a bottom, if it breaks through the 60 level and its downtrend line. Therefore, manage your trade cautiously, with a carefully plotted, pre-made plan you’re committed to, which allows you to navigate through the market’s potentially rough waters ahead.
Trading Strategies – Short-Position Setup
Conservative traders would wait with a short position for the flag to fizzle out, then retest the $40 level to confirm distribution.
Moderate traders, too, are likely to wait for the flag’s blowout and a return-move for a better short entry, if not for confirmation.
Aggressive traders might risk a short now, placing a close stop-losses in case the price completes a bullish flag. Here’s an example:
Trade Sample
- Entry: $41.50
- Stop-Loss: $42.50
- Risk: $1
- Target: $36.50
- Reward: $5
- Risk:Reward Ratio: 1:5
Author's Note: This is just a sample. It's one of many ways to approach the same trade, depending on your style. You should consider your timing, budget and temperament. If you don’t know how to do that, practice with small trades, with no expectation other than to learn. Trading is not easy. Don’t expect to become rich quickly—or at all.
