By Pinchas Cohen
Oil Bulls Crouch On Start Line Await Opening Shot
After the price of crude oil reached a two-and-a-half year high, it lost momentum, as was forecast here on Sunday. Also, last week we suggested oil should remain pressured below the $60 level. However, a pattern has been developing that may take it toward the $60 resistance.
The current known fundamental causes for this are the further rises in US output, which have thus far notoriously undermined OPEC-NOPEC production cuts. Traders are cautious on betting on further advances, and analysts, such as futures brokerage AxiTrader Chief Market Strategist Greg McKenna, are such things as, prices “are starting to look like a pause or pullback is needed.”
This sentiment, however, may turn around.

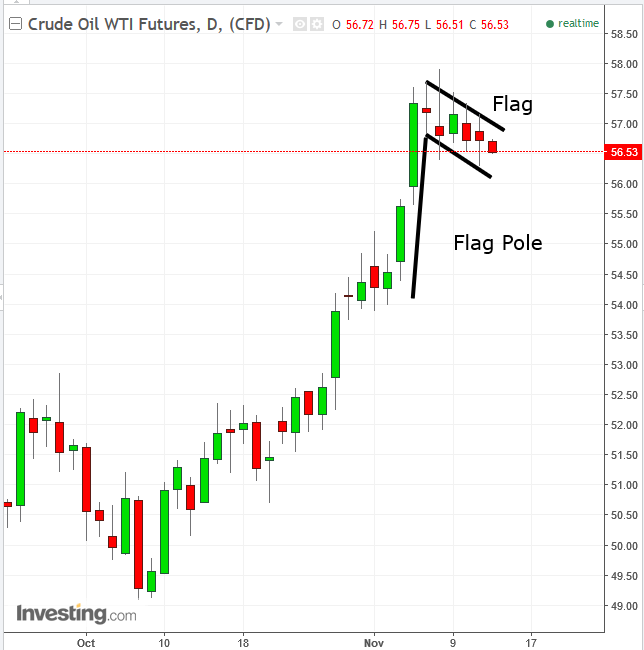
The commodity's three-day, rapid advance, followed by a congested pause with a downward bias are the telltale signs of a continuation pattern by the name of Falling Flag. Since it is a continuation pattern of an uptrend, it’s bullish.
Fundamentals Drive Oil Higher
Surprise fundamentals that support the case for a higher price are becoming known. On November 3, Baker Hughes said the number of active US rigs drilling for oil fell by 8 to 729 in the prior week. That was the fourth weekly decline in five weeks. Rumors of a crackdown on corruption in Saudi Arabia and Venezuela debt default risk became fact today, spurring investors to pile up on positions, and chasing up willing sellers, nearly $3.5 in 3 days.
The price is on pause for a sixth day, as investors catch their breath while trying to figure out if this was part of a larger move or not. Should the price provide an upside breakout, investors would see that as a signal for a repeat of the Flag Pole and chase each other up to more willing sellers. The psychological framework of this pattern suggests a repeated move, hence the $3.5 target from the point of breakout.
At that point, the price may be contained by the supply/demand balance, which we expect will keep it from climbing over the $60 level, as described in the second link of the first paragraph.
Trading Strategies
Conservative traders would wait on a long position for a decisive upside breakout, followed by a return-move, followed by the flag providing support, in which the price would bounce and close higher.
Moderate traders would wait on a long entry for an upside breakout and a return move to avoid whipsaw, but not necessarily for the pattern to prove its integrity.
Aggressive traders may be content with the upside breakout, to enter a long position.
