Get 40% Off
🚨 Volatile Markets? Find Hidden Gems for Serious OutperformanceFind Stocks Now

Chart of the Day: How To Trade The Dow's Rebound

Published 2018-08-06, 10:01 a/m
Updated 2020-09-02, 02:05 a/m

The Dow Jones Industrial Average is on a knife's edge between another rally and a slump, as economic tailwinds in the U.S. go head to head with resurging geopolitical risk.

The index climbed on Friday after the U.S. jobs report showed a steady labor expansion and wage growth in July, paving the way for further gradual tightening by the Fed against the backdrop of a "Goldilocks" economy.

This was enough to offset any downward pressure from re-ignited trade tensions on the large-cap benchmark.
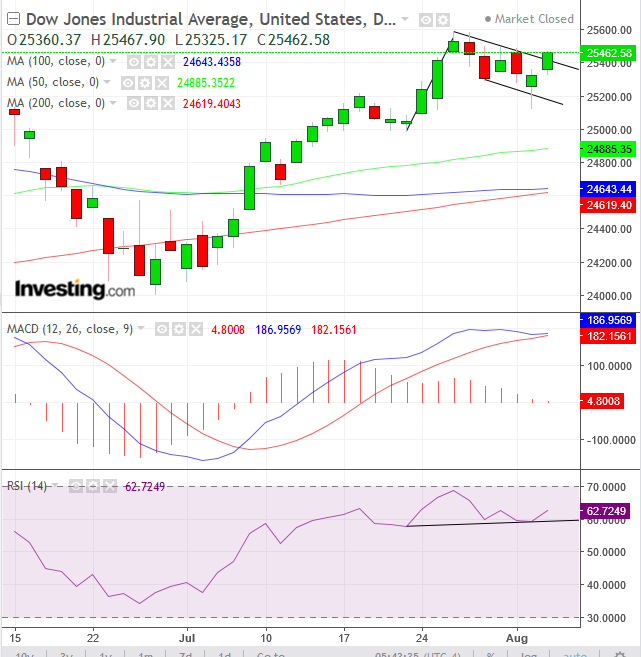
Dow Jones Daily Chart

The index closed at the top of a falling flag, bullish in the uptrend since June 28, from 24,000. Should it form a complete candle on top of the flag, despite the ramped-up tariff spat, it may signal that traders are prepared to bid prices higher based solely on the healthy state of the U.S. economy.

The falling flag reveals that demand absorbs any supply driven by profit-taking. The downward slope, after a sharp uptake, demonstrates the supply inundation. The upside breakout proves that demand overcame the momentary spike in supply. The penetration of the flag’s top presumably triggered stop-losses from short traders, who then must contribute to demand to cover their shorts, as well as buy orders from longs.

Notice how the 100 DMA (blue) and 200 DM (red) align The MACD’s longer and shorter MAs flatten and the RSI evened out, in anticipation of the next short-term move, determining the trajectory in the midterm. Also, note that should the upside breakout fail, all the above-stated indicators are poised for a bearish crossing.

3rd party Ad. Not an offer or recommendation by Investing.com. See disclosure here or remove ads .

Trading Strategies – Long Position Setup

Conservative traders would wait for proof that the primary, long-term uptrend is intact when the late-January peak is overcome with a fresh record high.

Moderate traders may trade the uptrend since the February low, when the July 26, 25,587.24, peak is superseded with a new high, resuming the uptrend, which would be followed with a return move that would successfully test the flag's validity, with at least one long, green candle engulfing a preceding red or small candle of any color.

Aggressive traders may enter a long position on the breakout.

Latest comments

Risk Disclosure: Trading in financial instruments and/or cryptocurrencies involves high risks including the risk of losing some, or all, of your investment amount, and may not be suitable for all investors. Prices of cryptocurrencies are extremely volatile and may be affected by external factors such as financial, regulatory or political events. Trading on margin increases the financial risks.
Before deciding to trade in financial instrument or cryptocurrencies you should be fully informed of the risks and costs associated with trading the financial markets, carefully consider your investment objectives, level of experience, and risk appetite, and seek professional advice where needed.
Fusion Media would like to remind you that the data contained in this website is not necessarily real-time nor accurate. The data and prices on the website are not necessarily provided by any market or exchange, but may be provided by market makers, and so prices may not be accurate and may differ from the actual price at any given market, meaning prices are indicative and not appropriate for trading purposes. Fusion Media and any provider of the data contained in this website will not accept liability for any loss or damage as a result of your trading, or your reliance on the information contained within this website.
It is prohibited to use, store, reproduce, display, modify, transmit or distribute the data contained in this website without the explicit prior written permission of Fusion Media and/or the data provider. All intellectual property rights are reserved by the providers and/or the exchange providing the data contained in this website.
Fusion Media may be compensated by the advertisers that appear on the website, based on your interaction with the advertisements or advertisers.
© 2007-2024 - Fusion Media Limited. All Rights Reserved.