Majid Jafar, CEO of Crescent Petroleum in the UAE said today, at the World Economic Forum in Davos that the price of oil could soar toward $80 by year-end on escalating risk of a significant producer (such as Venezuela) experiencing a major interruption.
Meanwhile, yesterday, the commodity's price advanced due to both a decline in US drilling as well as tension in Syria between Turkish and Kurdish forces.
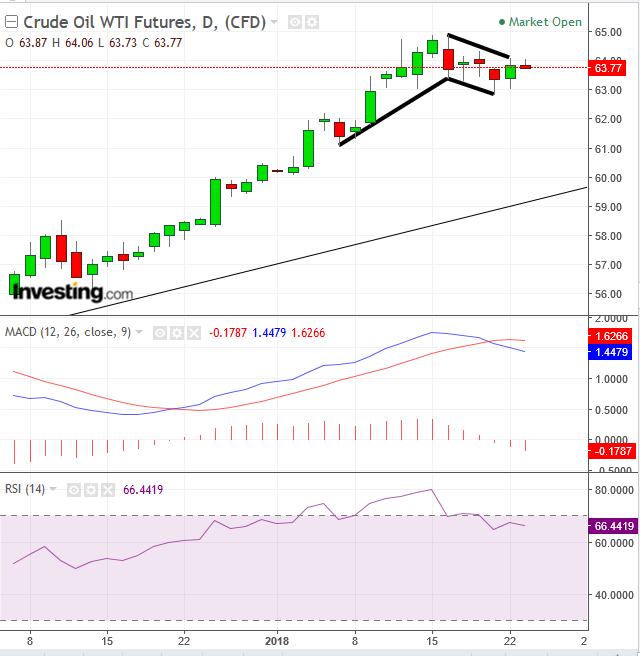
Today, after an earlier move higher, above $64, the price retreated for no obvious fundamental reason. We believe that the reason behind this retreat may be technical.

The price declined once it reached the resistance of the top of a bullish falling flag. The pattern is a consolidation made up of profit taking after the 6 percent advance between the low of January 5 and the high of January 15.
An upside breakout with at least one long candle above the pattern would signal that the profit-taking that made up the pattern allowed new blood to come in and take the next leg up.
It is important to warn that both the MACD (comparing prices within various period averages) and RSI (reflecting current relative to previous momentum) provided sell signals. Therefore, experienced traders are likely to wait for at least one candle that would demonstrate a decisive breakout with the following characteristics:
- The breakout occurs upon a close, not an intraday move.
- The candle should be longer than average since the flag's pole, which indicates the price move prior to the falling flag, was also longer. As a rule, the longer the flag pole, the more likely it is that traders are on the side of demand.
- The more solid it is, the more it shows that the bulls are in control. Lower but especially long upper shadows don’t signify a reliable breakout, as that demonstrates there are still enough bears to fight back, rendering it a false breakout and a bull trap.
- A full candle completely outside, in which even the low of the day cleared the pattern, sends a more reliable breakout signal, as it demonstrates the breakout is decisive.
Trading Strategies
Conservative traders would wait for an upside breakout to post a new peak in validation of the current uptrend, above the January 15, $64.89 high; then, wait for a return move and a confirmation of the flag’s support, with a rising candle, whose real body (price between open and close, excluding shadows) covers the preceding falling candle’s real body.
Moderate traders might wait for a new peak and return move, for a better risk-reward ratio with an entry closer to the flag’s support, but not necessarily for a confirmation of its integrity.
Aggressive traders may just wait for a new peak, or at least a decisive breakout, according to the four parameters set above.
Target: $4 from the point of breakout, likely to $68, as implied by the flag pole, as the supply-demand balance is likely to repeat its pattern on the upside of the breakout.
