Bitcoin just made the biggest increase to its mining difficulty in two and a half years. Around 12:00 PM EST on Tuesday, the rigor for block rewards rose to 15.78 trillion, marking the largest rise in reward-level since January 2018, just before the cryptocurrency crashed by more than 60% in the space of six weeks.
The increased challenge now for miners resides in finding a hash value that is lower than the target hash set by the network. This requires more computing power for the same number of blocks mined. The network adjusts the difficulty every 2,016 blocks, which works out to about every two weeks, to keep the average tie between each block to 10 minutes.
Perhaps that is why Bitcoin is losing steam.

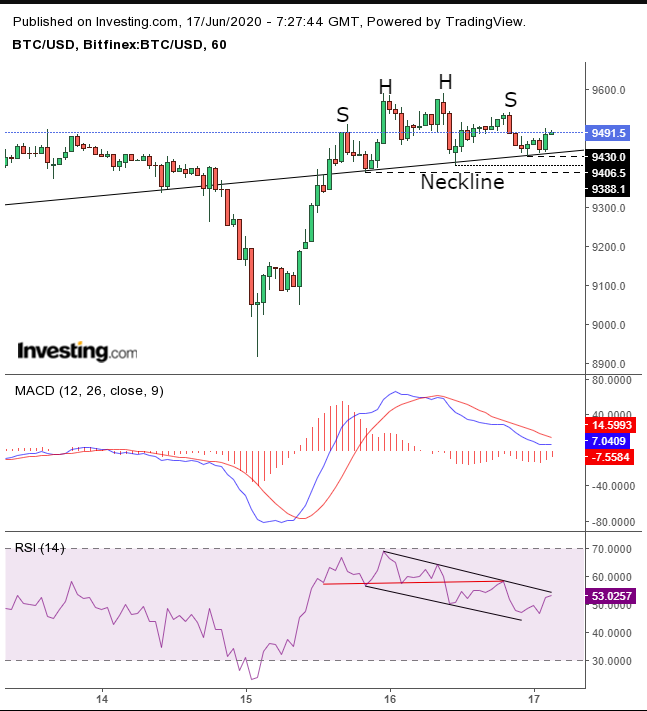
After a jump of almost $675, or 7.5%, in 19 hours, the rally is petering out. This move up preceded the fourth-largest difficulty increase in Bitcoin history.
What caught our attention was that we didn’t draw a neckline for this H&S top. Rather, it materialized naturally, with the daily uptrend line that has been in place since May 10, when the digital currency entered a range.
The MACD has been moving in a bearish formation since the emergence of this pattern. At the same time, the RSI topped out of its own H&S top, and proved its effectiveness when attempting to climb back. This led to a drop lower, which formed a falling channel.
If the built-in neckline breaks, and prices do edge lower, this would involve a re-test of the top of the longer-term falling channel since June. The price has been above that pattern since May 27, after two failed attempts earlier in the month.
Trading Strategies
Conservative traders should wait for a close below $9,388, the lowest price within the H&S pattern, posted June 15. Then, they should wait for a return move to re-test the integrity of the neckline, with at least one long red candle falling away from key resistance.
Moderate traders may be content with a close below $9406.5, the trough of the head in the second part of the H&S formation. They could wait for a corrective rally, like conservative traders, but for a better entry point, rather than to test resistance.
Aggressive traders may be content with a close below the $9,430, the right-shoulder low, provided they accept that the scenarios described in the lower-risk trading strategies are viable and are, therefore, prepared to set a stop-loss that would accommodate such whipsaw action, or accept a loss on the position.
Trade Sample – Aggressive Short Position
- Entry: $9,425
- Stop-Loss: $9,450
- Risk: $25
- Target: $9,300
- Reward: $125
- Risk-Reward Ratio: 1:3
