
Last week’s Bitcoin downturn led to a decrease below its 50-week moving average (MA). This has historically indicated that a downtrend has begun.
However, the Bitcoin price initiated a bounce once it reached the support line of its current pattern on Nov. 25. Due to this occurrence and the proximity to the next halving, it is not likely that a long downtrend will begin.
Cryptocurrency enthusiast and analyst @pladizow stated that the 50-week MA has previously been instrumental in determining the length of Bitcoin’s downtrend. A cross below has historically been a catalyst for a prolonged downward trend.
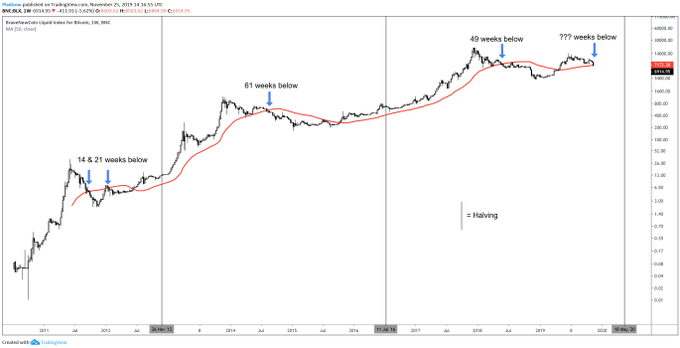
The previous times Bitcoin closed under the 50-day MA, it began bearish trends of 16, 21, 61 and 49 weeks. Let’s take a closer look at this MA and see if the price will follow a similar pattern.
Bitcoin Bearish Trend Confirmation
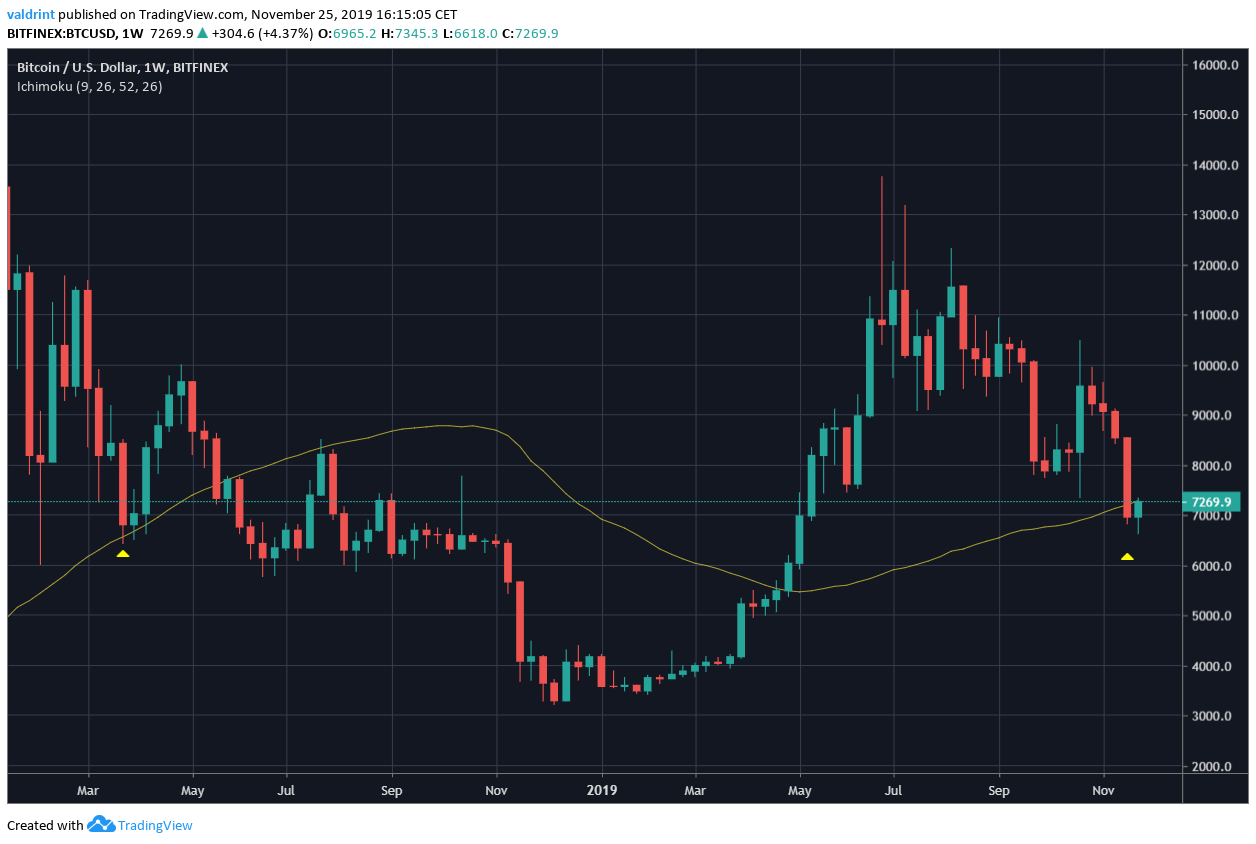
Looking closer at the price movement, we can see that Bitcoin has not yet reached closing below the 50-week MA. It has only done so marginally and has begun the current week in the green.
Therefore, we could very well see a movement in which BTC moves above this MA and uses it as support, similar to what happened in March 2018.
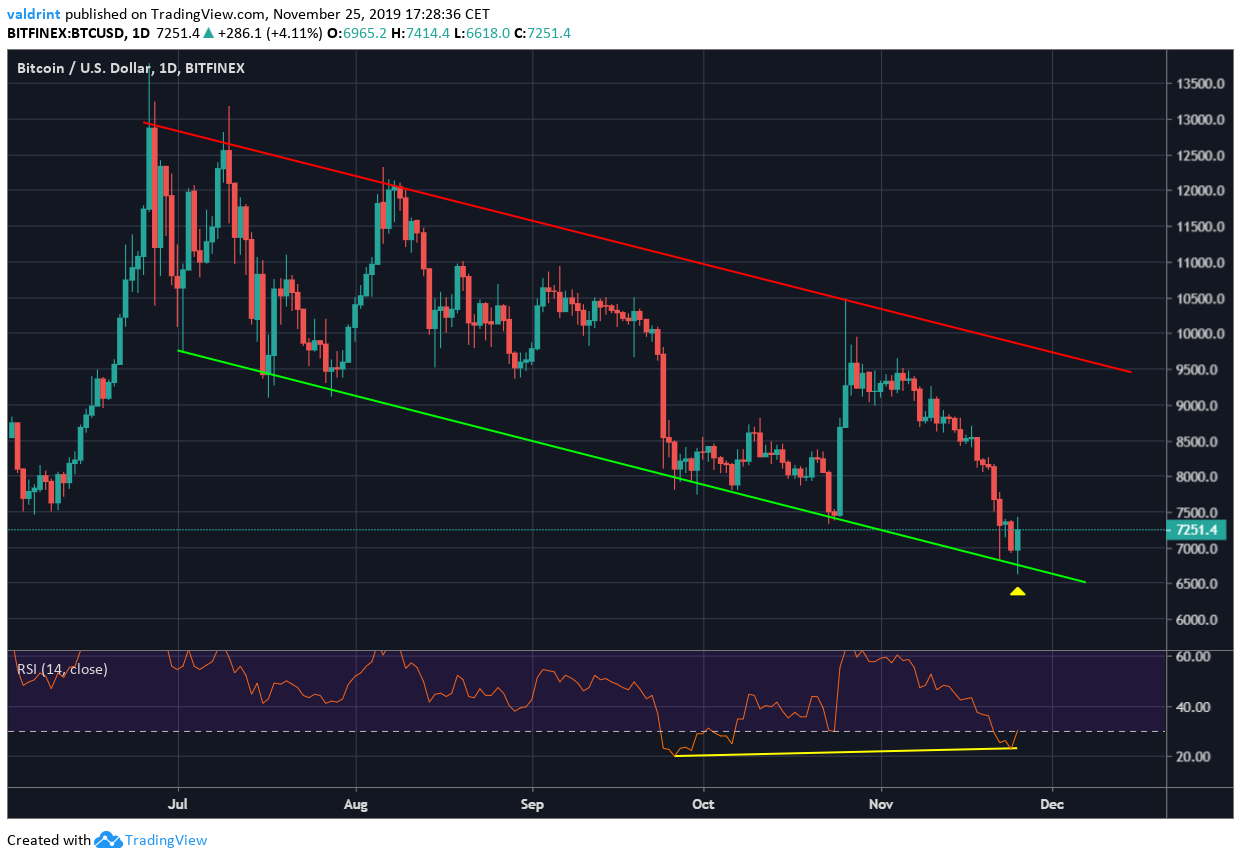
The outlook for lower time-frames also aligns with this scenario.
The price reached the support line and initiated a bounce that is still ongoing. If the price were to move towards the resistance line, which does not seem unlikely, it may reach a close above the 50-week MA.
Next Halving
Another event to factor in is the next Bitcoin halving. The price has historically crossed below the 50-week MA long before the halving and then has continued to initiate an upward move that has lasted well after the event.
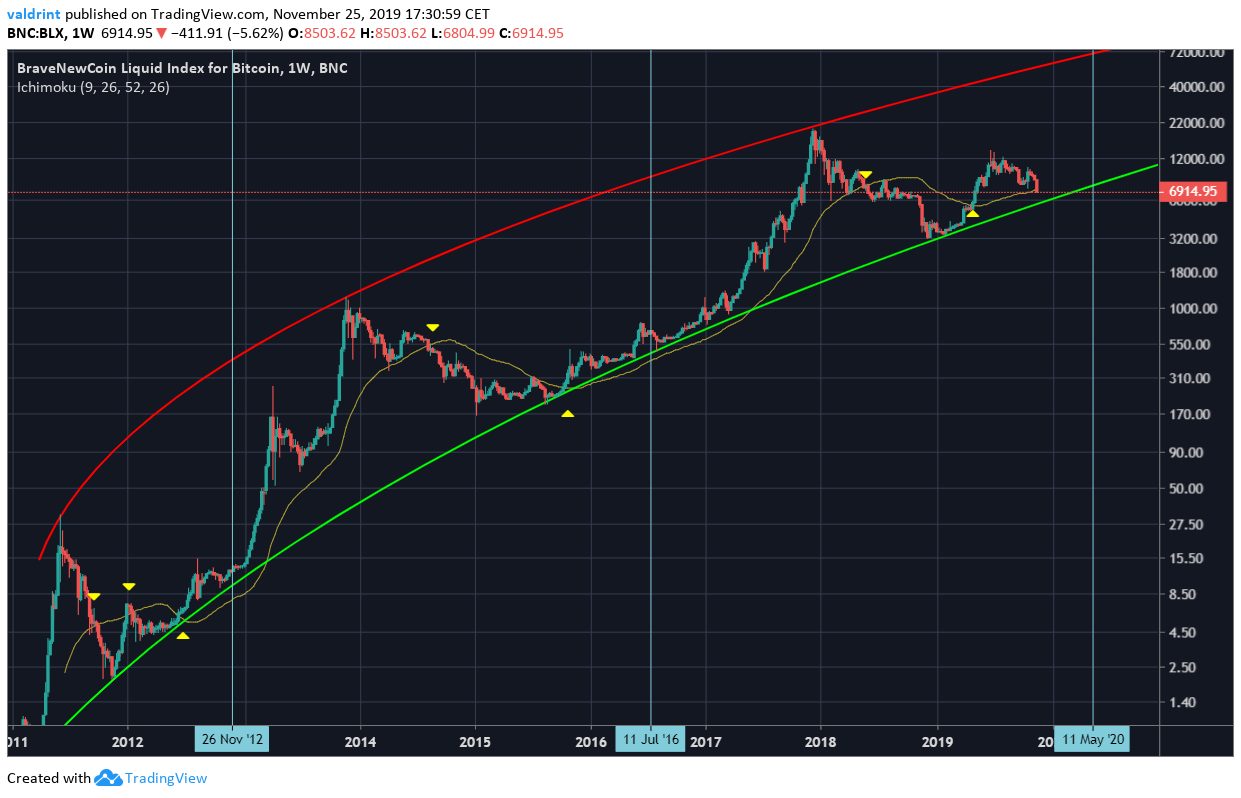
Initially, the current movement had several similarities with those before the second halving. More specifically, once the price crossed above the 50-week MA, it seemed primed to continue on an upward trajectory until the halving.
However, with the recent cross, we could see movement similar to that in 2012, when the price crossed below the 50-week MA then increased incrementally until it touched the support line, before accelerating its rate of increase.
This is possible, even though the previous scenario in which the price closes above the weekly MA seems more likely.
To conclude, while the price has decreased below its 50-week MA, it has only done so marginally. This does not seem like the beginning of a long downward trend.
Disclaimer: This article is not trading advice and should not be construed as such. Always consult a trained financial professional before investing in cryptocurrencies, as the market is particularly volatile.
Images courtesy of Twitter, TradingView.