
The Bitcoin price initiated a relief rally on Nov. 25. The inability to continue that rally has caused the price to create a bearish outlook in the long-term — suggesting that it will continue heading lower.
This extended cryptocurrency correction, beginning in December 2017, has had numerous negative effects in the cryptocurrency industry. CryptoBridge, a decentralized cryptocurrency exchange, announced today that it will be closing down. During the 2017 bull run, a countless number of exchanges entered the market, looking to gain a share of the profits. However, as the bear market continued, trading volume plummeted, making it difficult for the exchanges to continue.
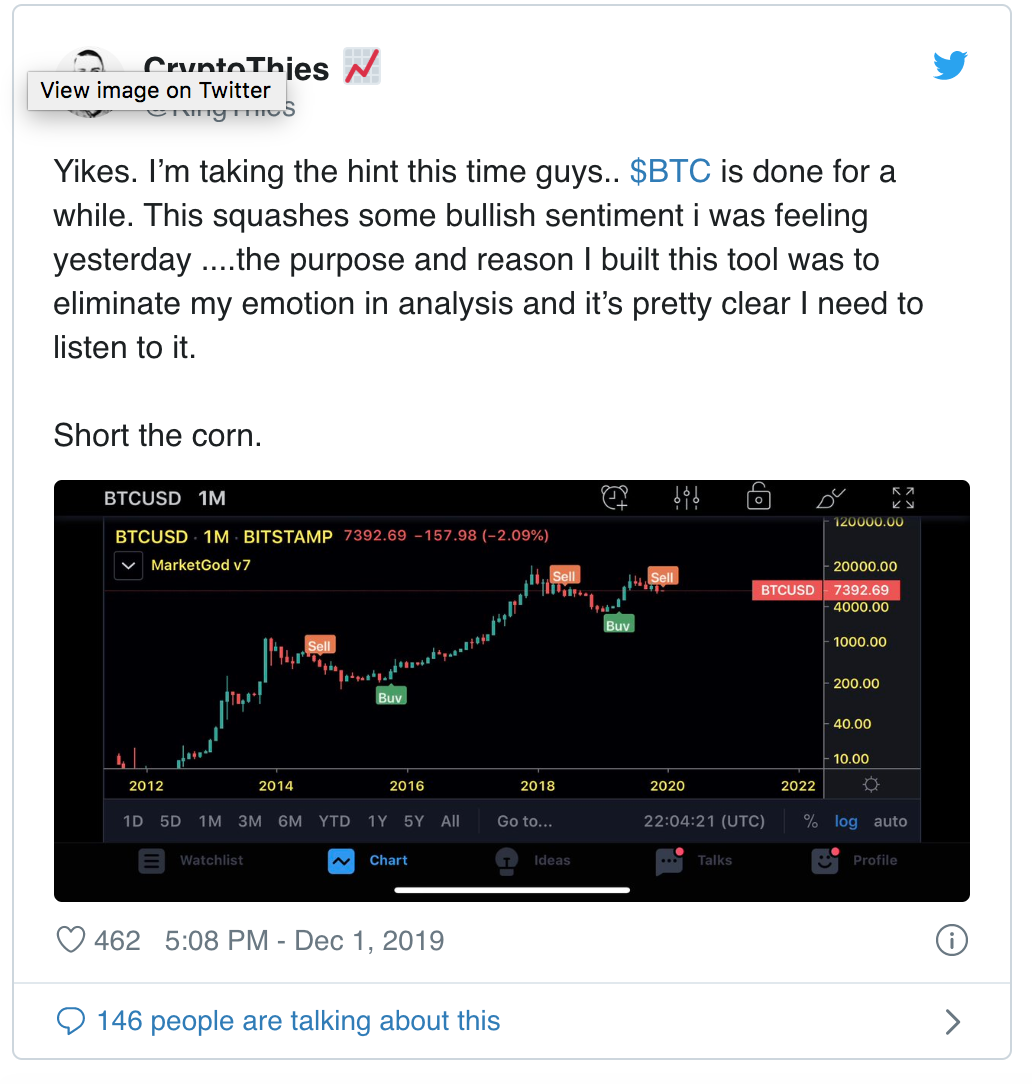
The current Bitcoin long-term pattern is suggesting that the current Crypto Winter is not done and further price decreases await. A similar sentiment was given by cryptocurrency trader and analyst @kingthies, who stated that he believes the Bitcoin price is done increasing for a while. An analysis tool that he is using has given him a sell signal. The same signal has been given twice before, at the beginning of the correction in 2014 and shortly after the December 2017 high.
While we do not have the same tool, we can look at different indicators and analyze the price movement to see if that really is likely.
Bitcoin in a Descending Channel
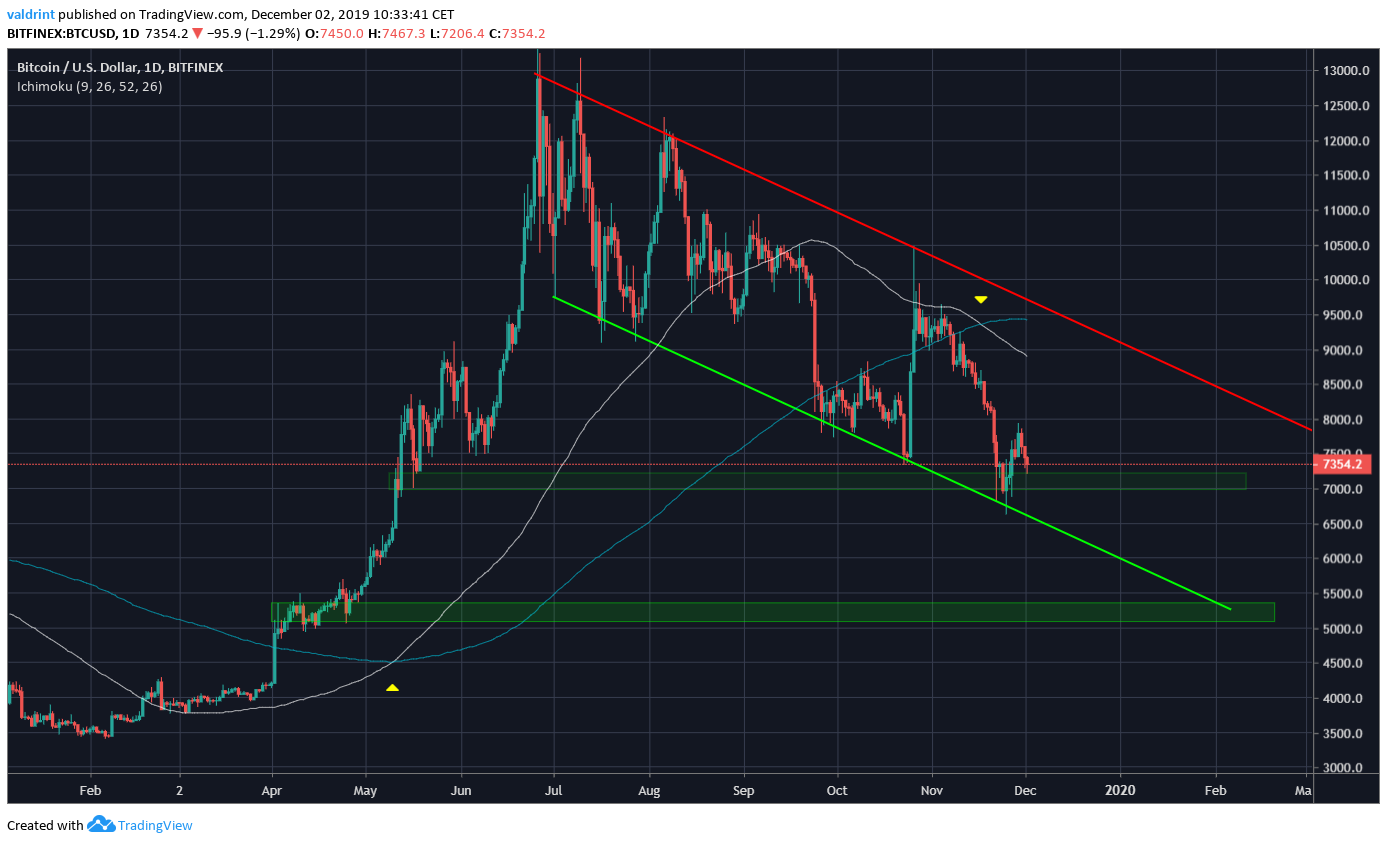
Looking at the daily chart, we can see that BTC is trading inside a descending channel. It bounced on the support line on Nov. 25 and has been increasing since. This movement solidified strong support above $7,000.
The next support area is found in the low $5,000s. If the price does not break down from the pattern but decreases at its rate, it will reach it in February 2020.
Also, a bearish cross between the 100- and 200-day moving averages has transpired. This suggests that the price is likely to continue heading lower. A bullish cross between the same MAs preceded the entire upward move.
Long-Term Chart
Looking at Bitcoin’s price since its inception, we can see that it is trading inside both ascending resistance and support lines.
Both in the 2014 correction and the current one, the price made a bottom at the convergence between the 200-week MA and the support line. Both times, it moved above the 100-week MA shortly after and accelerated its rate of increase.
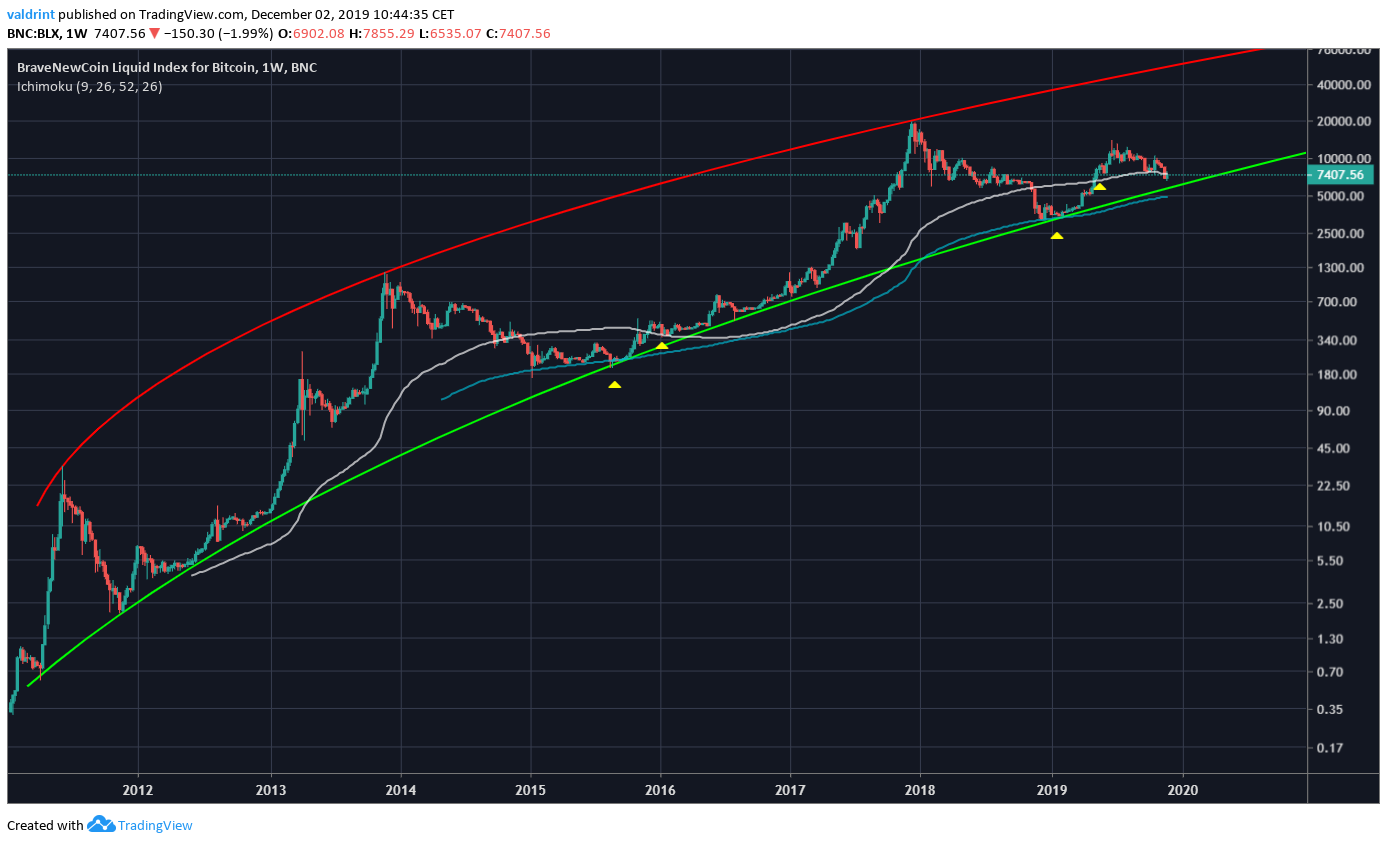
However, the price again has fallen below this MA. Additionally, the price could not close above the previous support area and has now validated it as resistance.
Therefore, we could definitely see another leg downward with the price possibly bouncing at the convergence of support between the channel, long-standing support line, and the 200-week MA.
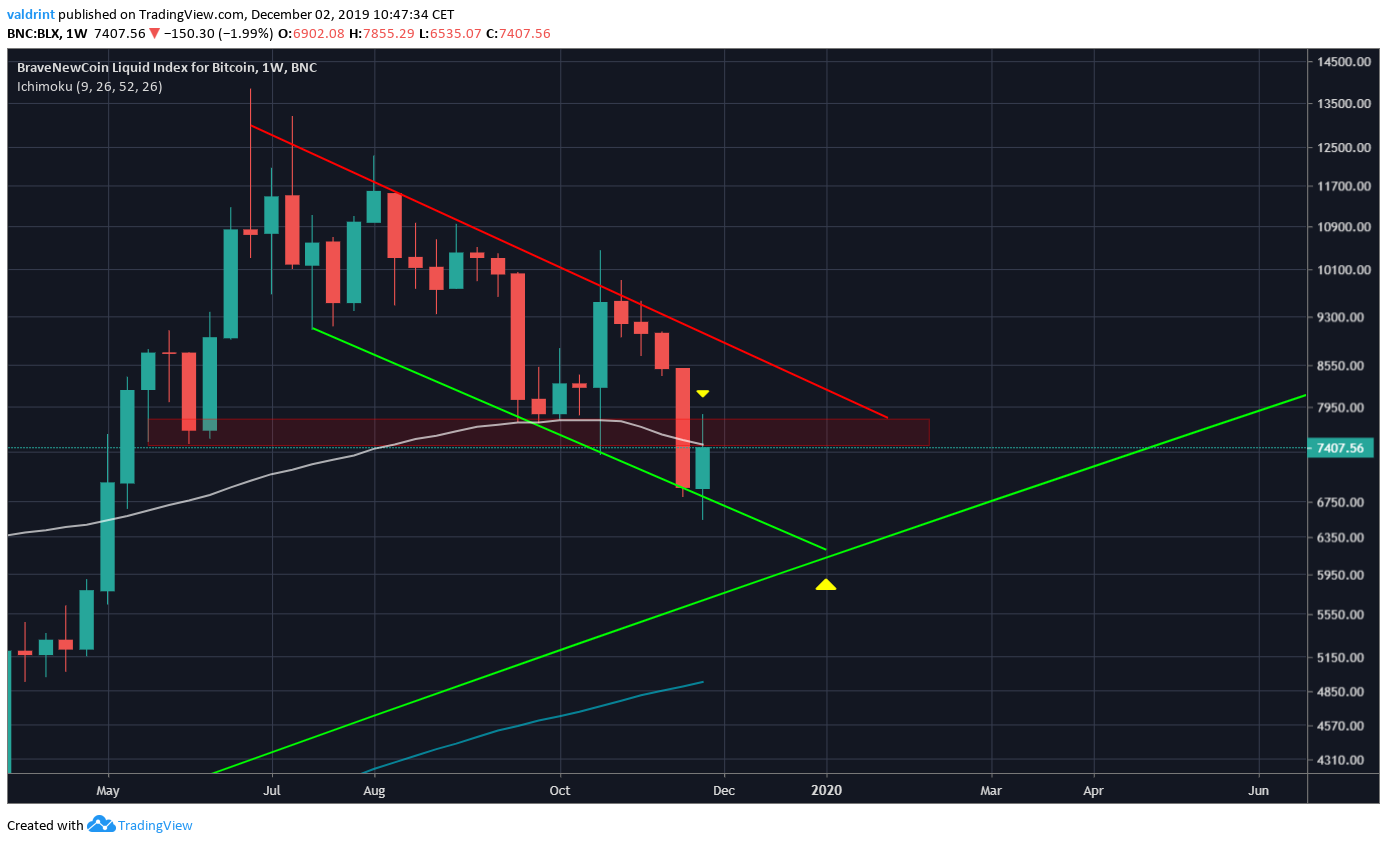
To conclude, the long-term Bitcoin chart looks bearish. We could potentially see a move towards $6000 and possibly slightly lower.
Disclaimer: This article is not trading advice and should not be construed as such. Always consult a trained financial professional before investing in cryptocurrencies, as the market is particularly volatile.
Images courtesy of Shutterstock, TradingView.