
The Bitcoin price is approaching a significant support area. Based on prior movement, a decrease below it could it take into uncharted territory.
The Bitcoin price often repeats its movement patterns based on its prior history. One baseline event before and after which the price has acted in an almost identical manner has been the block-reward halving.
Prior to halving, the Bitcoin price movement has been bullish. The 2014 and 2017 price peaks were reached after the event. However, this has not been the case in 2019 — since we have been inside a bearish trend since June 26. The next halving is expected to occur in May 2020.
The current price action has many people concerned since the recent decrease below $8,500 could be viewed as an indication that the market is correcting from the rapid upward move from $3,000 to $14,000.
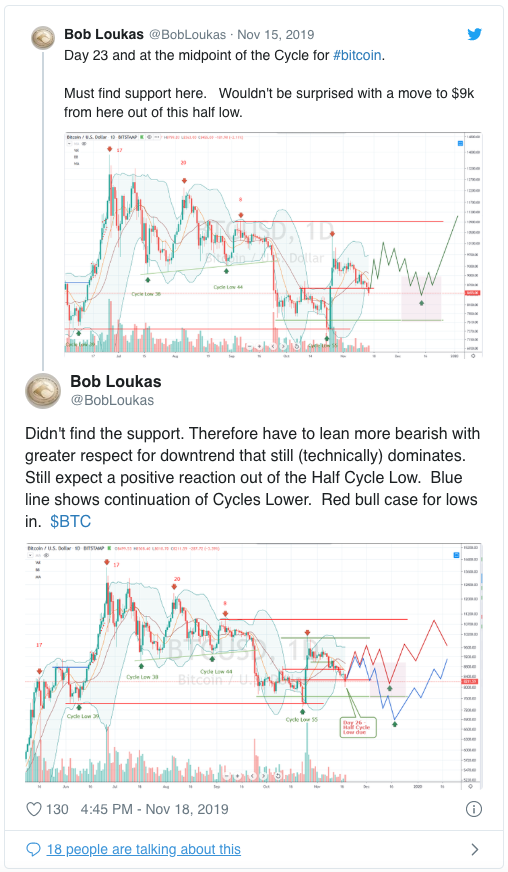
Cryptocurrency analyst Bob Loukas stated the Bitcoin price has decreased below a significant support level — which has caused him to lean towards being bearish.
Short-Term Bitcoin Bounce
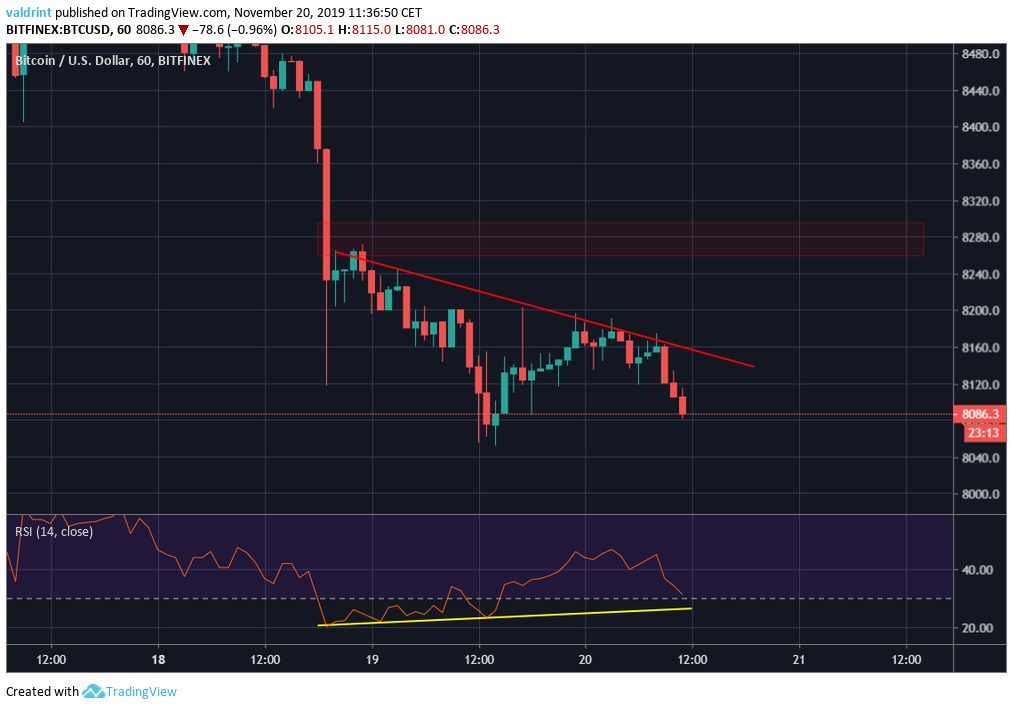
In the short-term, Bitcoin has been trying to find support above $8,000. It is also following a descending resistance line.
While the market structure looks bearish, there is a bullish divergence trendline developing in the RSI. However, it is only visible in the lower time-frames.
If the price breaks out, it is likely to find resistance at $8,300. The breakout volume could go a long way in determining whether the price will move above this area.
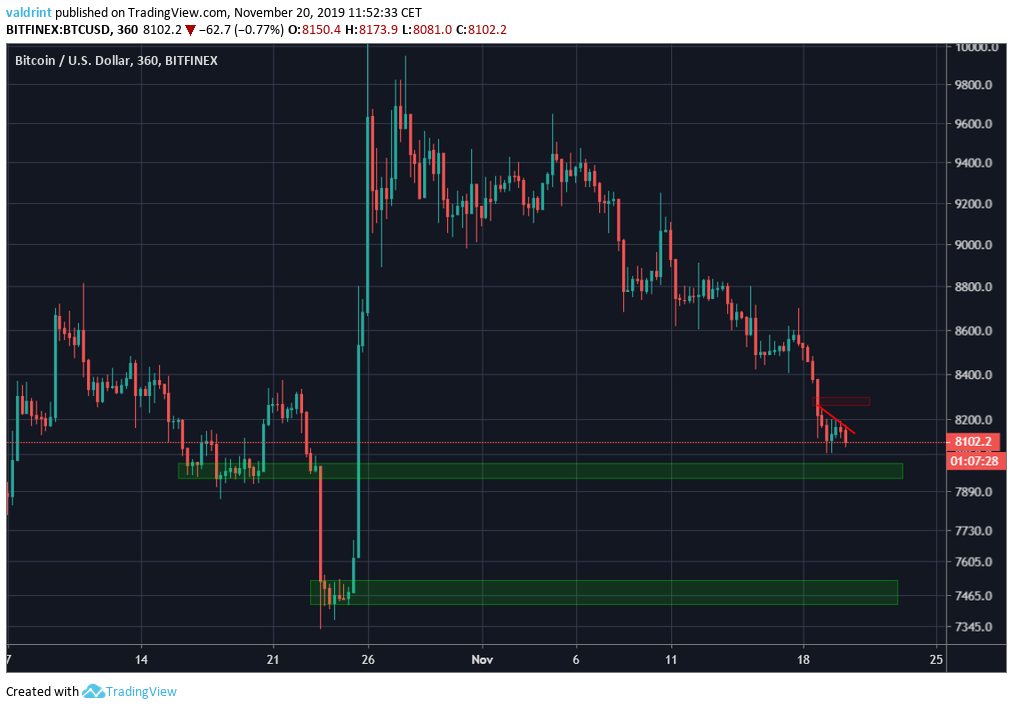
Looking at a slightly higher time-frame, we can see two minor support areas — at $8,000 and $7,500. If the Bitcoin price does not bounce at one of these areas, we could soon see a rapid price decrease.
Prior History
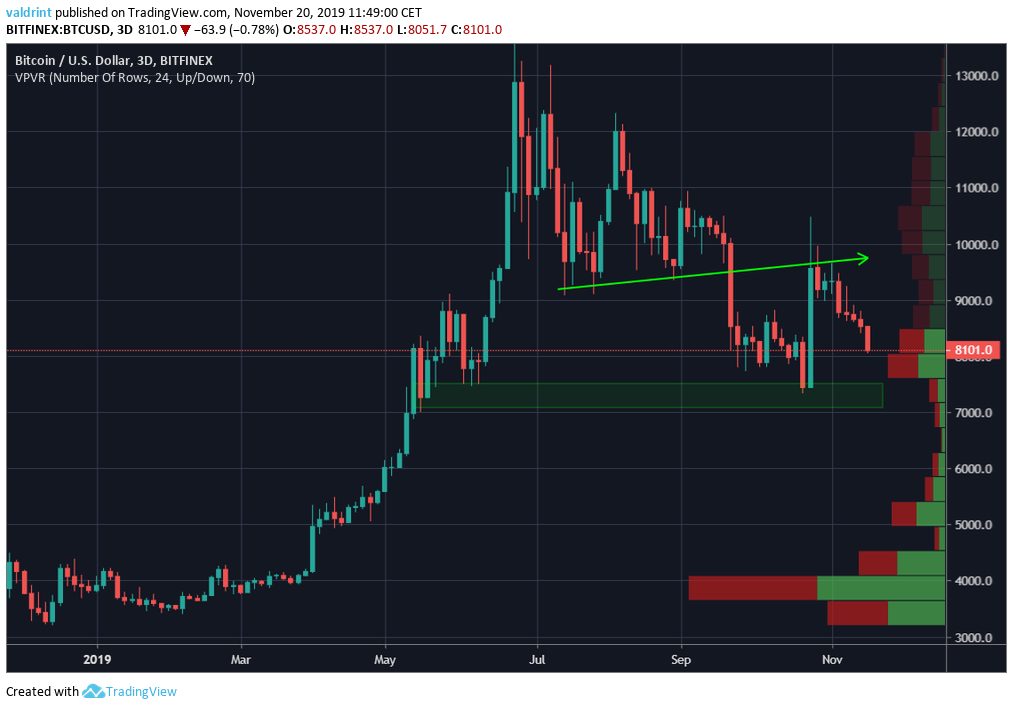
Higher time-frames show that the Oct. 25 rapid Bitcoin price increase ended once we reached the previous support line. Validation of a previous support line is a bearish development that often leads to further decreases — as was the case in BTC.
Additionally, the volume profile indicators show a lack of support below $7,500. The $7,000-$7,500 support area should act as a last resort. A price decrease below it could trigger a rapid downward move.
Looking at the weekly log chart, we can see that the Bitcoin price is close to a support line that has been in place since 2011. A breakdown below $7,000 would cause the price to decrease below this line.
The vertical lines represent block-reward halving dates. If the price acts as it has during prior halvings, we could see a drop towards the support line before a reversal commences.
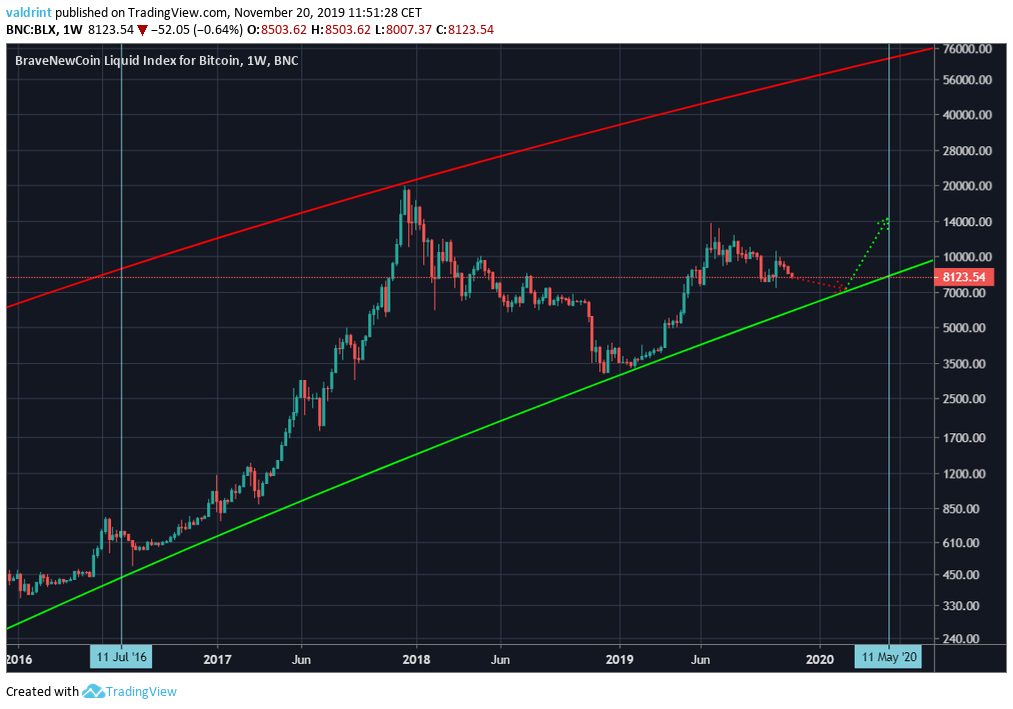
Therefore, if long-term trendlines and prior market movement are anything to go by, the price may not fall below $7,000 and may soon begin a new upward move.
Disclaimer: This article is not trading advice and should not be construed as such. Always consult a trained financial professional before investing in cryptocurrencies, as the market is particularly volatile.
Images courtesy of Twitter, TradingView.