The U.S. equity market finished Q3 2019 in modest style early last week. The S&P 500 and Dow gained 1.19% each, but the NASDAQ slipped 0.09%.
The market slumped again as October kicked off, with huge losses Tuesday and Wednesday that were not quite offset by big rallies on Thursday and Friday. The SPX was off 0.33% with the Dow off 0.92%. The NASDAQ gained 0.9%
More significant, there were 5 trends visible in the market's performance that affected stocks during the first week of October, which could influence trading for the rest of the year. Here are the key takeaways:
1. The SPX Peaked in Late July, Has Struggled Since
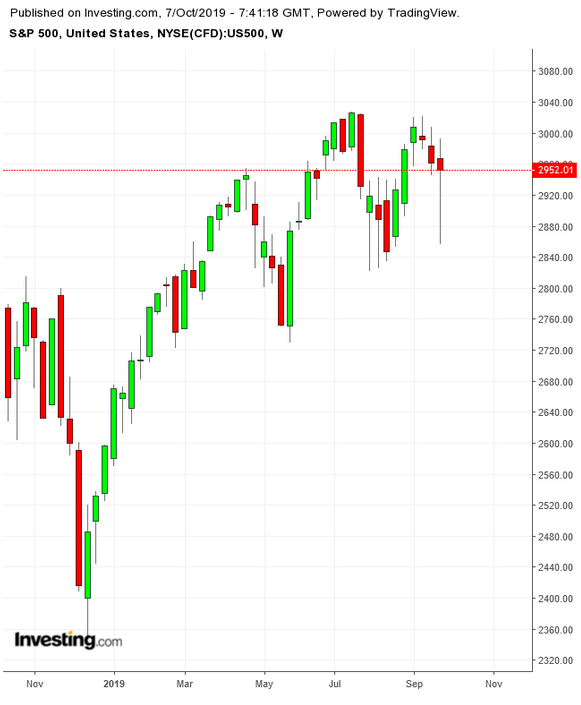
The S&P 500 hasn't closed above 3,000 since Sept. 19 and is off 2.5% from its intraday peak of 3,027.98 reached on July 26. Meanwhile, it came close to hitting that intraday on Sept. 19 but failed.

Technically, that's not a good sign. When a stock or index comes close to but fails to pass beyond a recent high, that’s a signal that investors may be skeptical about the rally’s continued strength. In the case of the S&P 500, the macro worries are creating the doubts.
Equally important, stocks may be losing their momentum. At the end of the quarter, the S&P 500 was up 18.7% for the year, but 70% of that gain came during the first quarter when the benchmark index jumped 13.1%. In the third quarter, the SPX fell 0.8%.
2. Geopolitical Forces Pressuring Markets Need to Resolve
Investors and their algorithms have been flummoxed by the contentious, seemingly unending U.S.-China trade dispute. It's now starting to weigh on U.S. manufacturing and other sectors. Negotiations are set to start again next week, but China is proving to be politically resilient.
The tariff tiff has contributed heavily to anemic U.S. economic growth and caused a plethora of angry tweets generated by President Donald Trump which also stresses markets, though he mostly blames the Federal Reserve for ongoing declines. Of course, Trump also forgets that an array of arguably more significant negative drivers are weighing on stocks along with the Sino-U.S. dispute, including depressed farm prices and Boeing's (BA) still pending struggle to get its 737 MAX jetliners back in the air.
Add to that an economic slowdown in Europe, especially in Germany and the United Kingdom, which is also worrying investors. Plus two new issues:
Perhaps the biggest wild card is Trump's tweets, particularly on China and the Fed. They've set off abrupt selling on multiple days this year.
3. Gains Increasingly Driven by Fewer Stocks, Rotating Sectors
Consider the Dow. About 54% of the 30-component index's 13.9% gain in 2019 can be credited to just five stocks: Apple (NASDAQ:AAPL), Home Depot (NYSE:HD), Boeing, Visa (NYSE:V) and Microsoft (NASDAQ:MSFT).
Nearly 59% of the NASDAQ 100's 22.5% appreciation this year is due to gains for Apple, Microsoft, Amazon.com (NASDAQ:AMZN), Facebook (NASDAQ:FB), Comcast (NASDAQ:CMCSA), both classes of Google parent Alphabet (NASDAQ:GOOG), (NASDAQ:GOOGL) and Costco Wholesale (NASDAQ:COST).
But lately, the uncertainty facing markets has spurred a rotation. As of Friday's close, five Dow stocks are now trading within two percentage points of their 52-week highs: Nike (NYSE:NKE), Procter & Gamble (NYSE:PG), Walmart (NYSE:WMT), Home Depot and Verizon(NYSE:VZ). The average Dow stock is trading more than 10% below its 52-week high. A 10% decline from a peak is the traditional measure of a correction.
Only 10 NASDAQ 100 stocks have prices that are two percentage points or less from their 52-week highs. Apple is the most prominent at 0.6%. Others include Dollar Tree (NASDAQ:DLTR), PepsiCo (NASDAQ:PEP), Celgene (NASDAQ:CELG) and Charter Communications Inc (NASDAQ:CHTR).
Microsoft is 3.2% below its 52-week high. Amazon is 14.7% below its all time high, set nearly a year ago.
4. Housing and Housing-Related Stocks May Be Heading For a Bubble
This is a tricky call because real estate sales and new construction still haven't recovered from the big construction crash that began in 2007.
Low mortgage rates, however, seem to have pushed building permits and housing starts to their highest levels this year, despite huge affordability issues in major markets.
Low rates set off a huge bubble in the early 2000s.
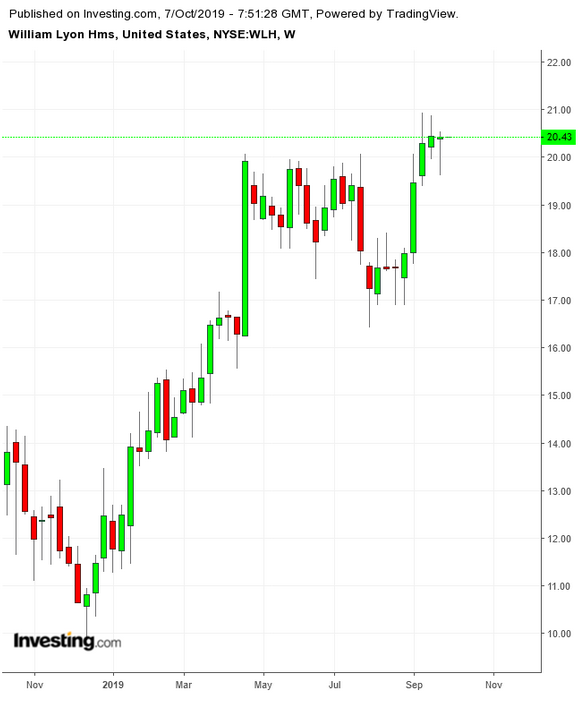
Homebuilder shares, meanwhile, are soaring. D.R. Horton (NYSE:DHI), PulteGroup (NYSE:PHM), Lennar (NYSE:LEN) and NVR (NYSE:NVR), the four largest by sales volume, are up an average of 50% this year.

Shares of William Lyon Homes (NYSE:WLH), a big West Coast builder, are up 91%. The S&P 500, on the other hand, is up only 17.76%.
P/E ratios suggest these stocks aren't overvalued, but gains this big probably can't be sustained.
5. IPOs Gone Sour: the Uber-Lyft-WeWork-Peloton Problem
Inevitably, even in overheated markets, there's always a stock or a stock-related event that investors realize is just plain looney, like 2007's $45 billion buyout of TXU, a massive Texas utility by such giants of the buyout world as KKR, Goldman Sachs and Berkshire Hathaway.
In the case of TXU, when energy prices collapsed, the company became crippled. The audaciousness of the deal was a signal of just how overheated the financial markets had become. Stocks peaked later that year, and of course no one will forget what happened at the end of 2008.
This year's red flag is highly-touted, extreme-valuation initial public offerings (IPOs) that have stumbled badly after trading began or, in the case of WeWork parent We, were aborted before trading even started.
Uber (NYSE:UBER), Lyft (NASDAQ:LYFT), WeWork and Peloton Interactive (NASDAQ:PTON) each showed rapid revenue growth. Profits, however, don't exist and likely won't for some time to come. And now, investors are refusing to pay up for losses.
The question for forward looking investors is simple. Despite the end-of-week rally, will these IPO problems, along with the additional factors listed above, prove to be psychological downers for stocks? We can't know, of course, but it pays to be aware of the technical factors as well as the fundamentals.
